 3
3peptides
spectra
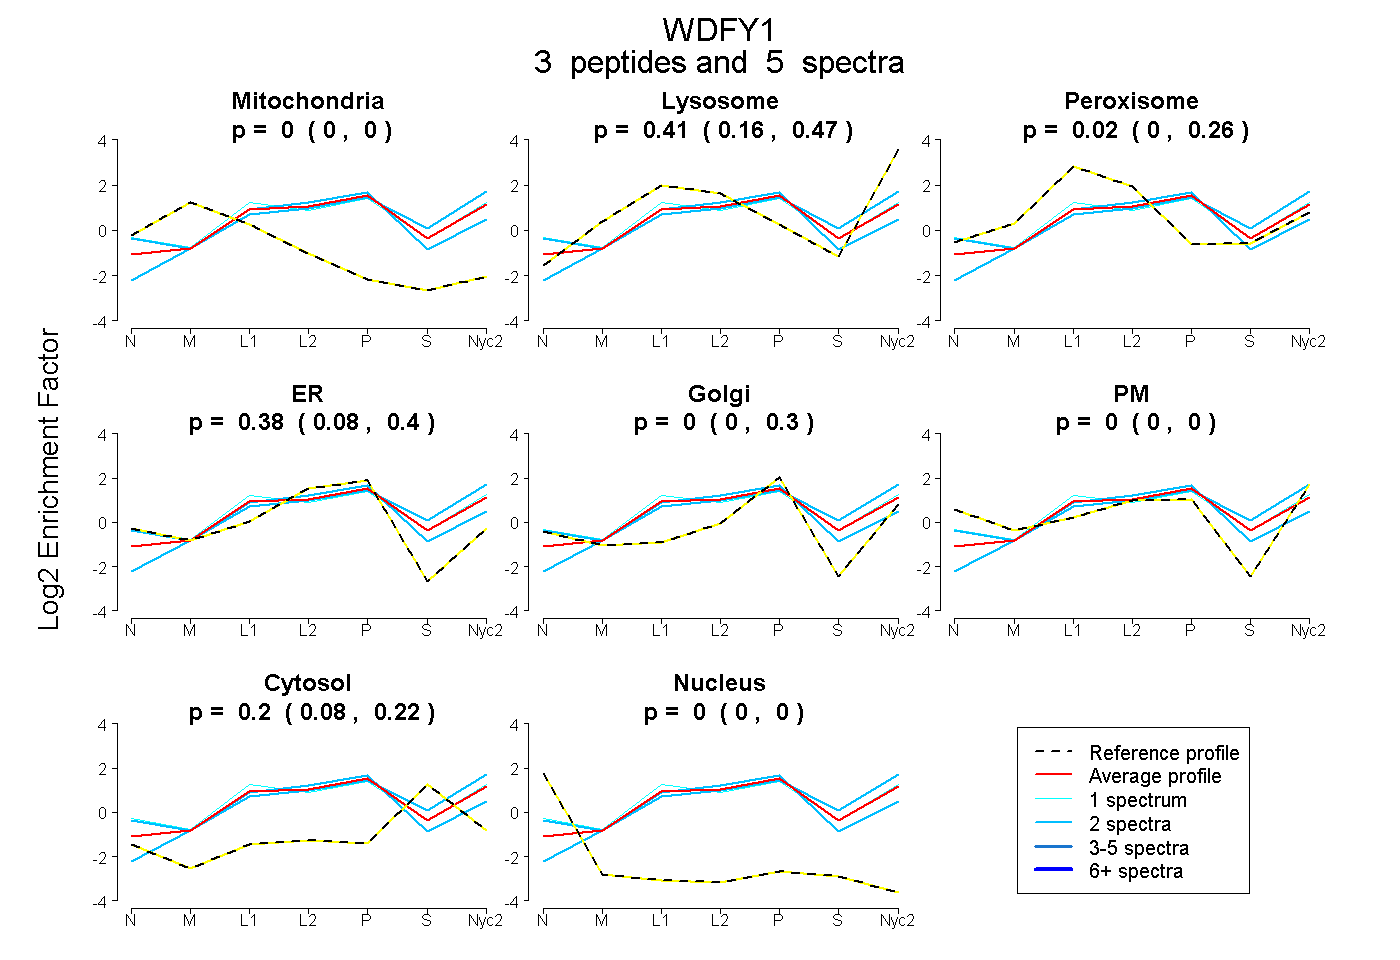
0.000 | 0.000
0.163 | 0.468
0.000 | 0.259
0.081 | 0.399
0.000 | 0.297
0.000 | 0.000
0.085 | 0.220
0.000 | 0.000
1peptide
spectrum
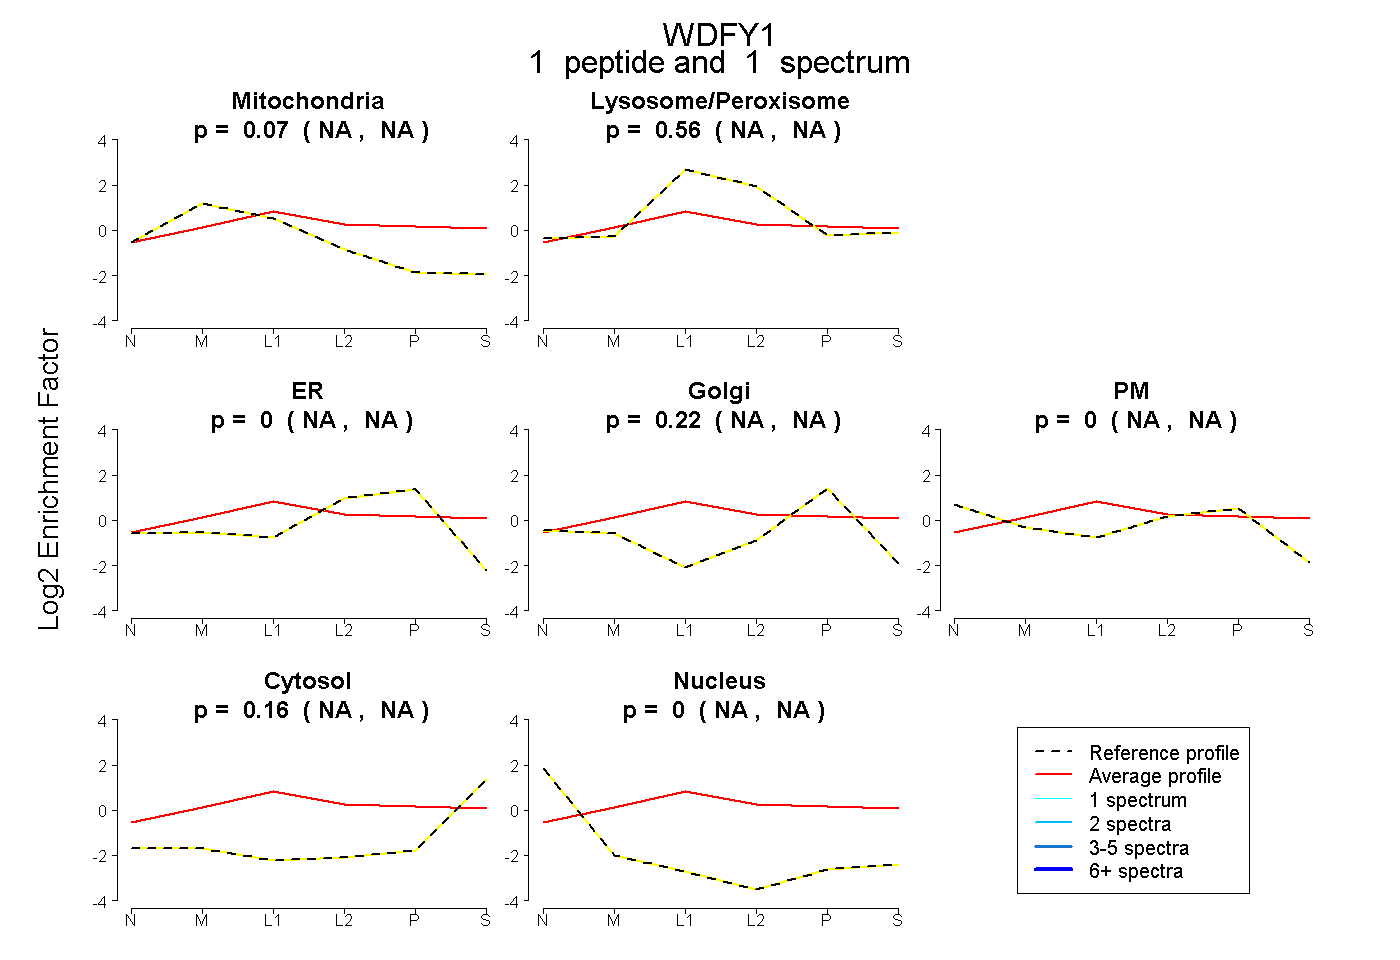
NA | NA
NA | NA
NA | NA
NA | NA
NA | NA
NA | NA
NA | NA
1peptide
spectra
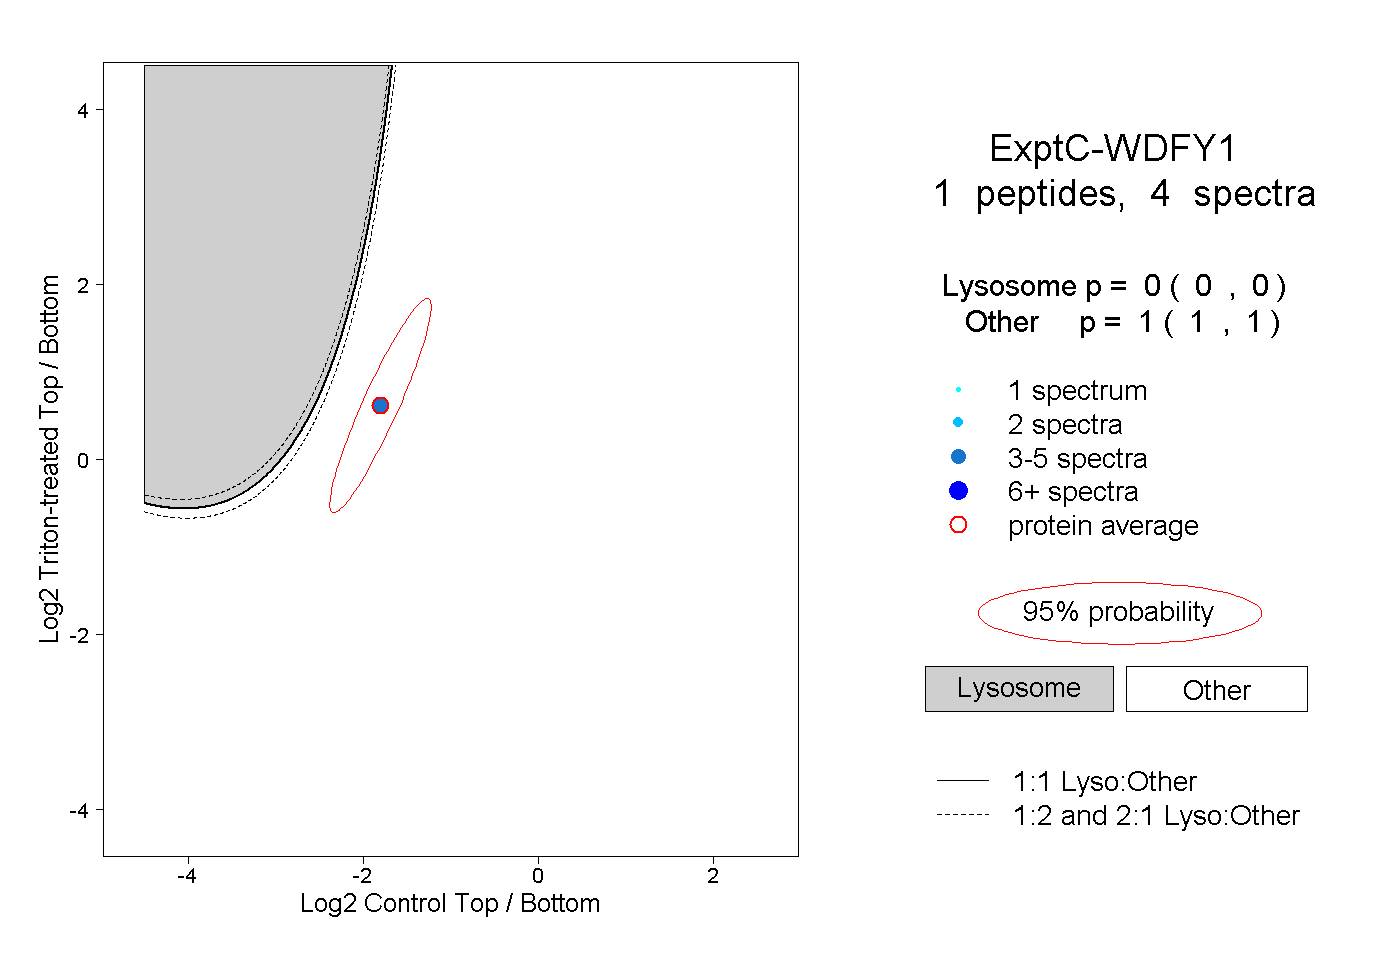
0.000 | 0.000
1.000 | 1.000