 3
3peptides
spectra
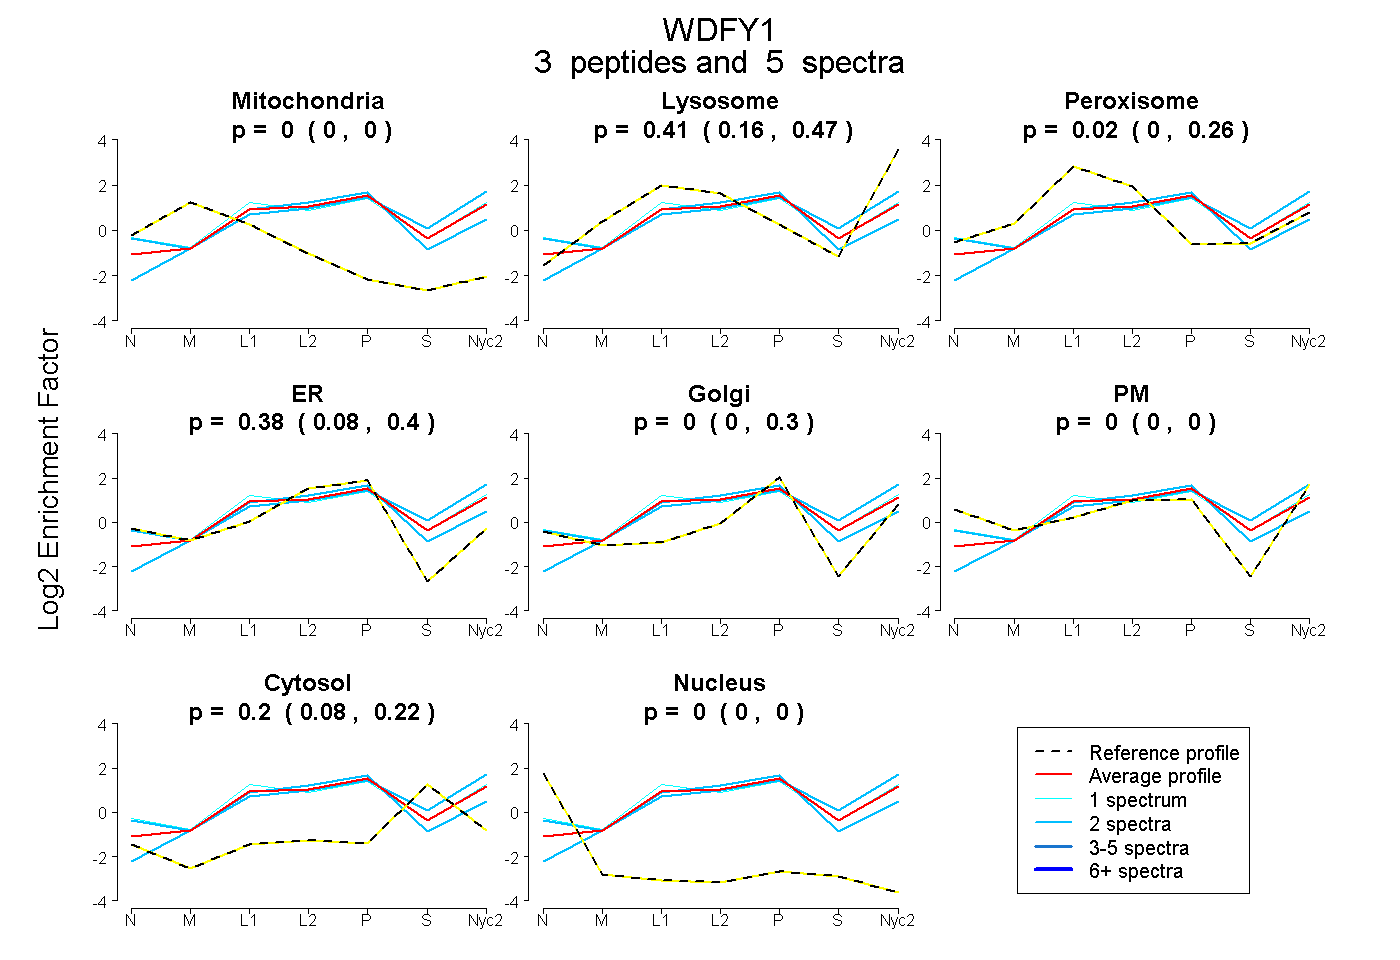
0.000 | 0.000
0.163 | 0.468
0.000 | 0.259
0.081 | 0.399
0.000 | 0.297
0.000 | 0.000
0.085 | 0.220
0.000 | 0.000
| Plot | Mito | Lyso | Perox | ER | Golgi | PM | Cytosol | Nucleus | |||||
| Expt A |
3 peptides |
5 spectra |
|
0.000 0.000 | 0.000 |
0.407 0.163 | 0.468 |
0.020 0.000 | 0.259 |
0.377 0.081 | 0.399 |
0.000 0.000 | 0.297 |
0.000 0.000 | 0.000 |
0.195 0.085 | 0.220 |
0.000 0.000 | 0.000 |
| 1 spectrum, LEQNSCSVITTLK | 0.000 | 0.146 | 0.389 | 0.000 | 0.398 | 0.000 | 0.068 | 0.000 | ||
| 2 spectra, TLLLQGHHDR | 0.000 | 0.552 | 0.000 | 0.112 | 0.080 | 0.000 | 0.256 | 0.000 | ||
| 2 spectra, VQSLCYLQLTR | 0.000 | 0.042 | 0.317 | 0.341 | 0.237 | 0.000 | 0.063 | 0.000 |
| Plot | Mito | Lyso or Perox | ER | Golgi | PM | Cytosol | Nucleus | ||||||
| Expt B |
1 peptide |
1 spectrum |
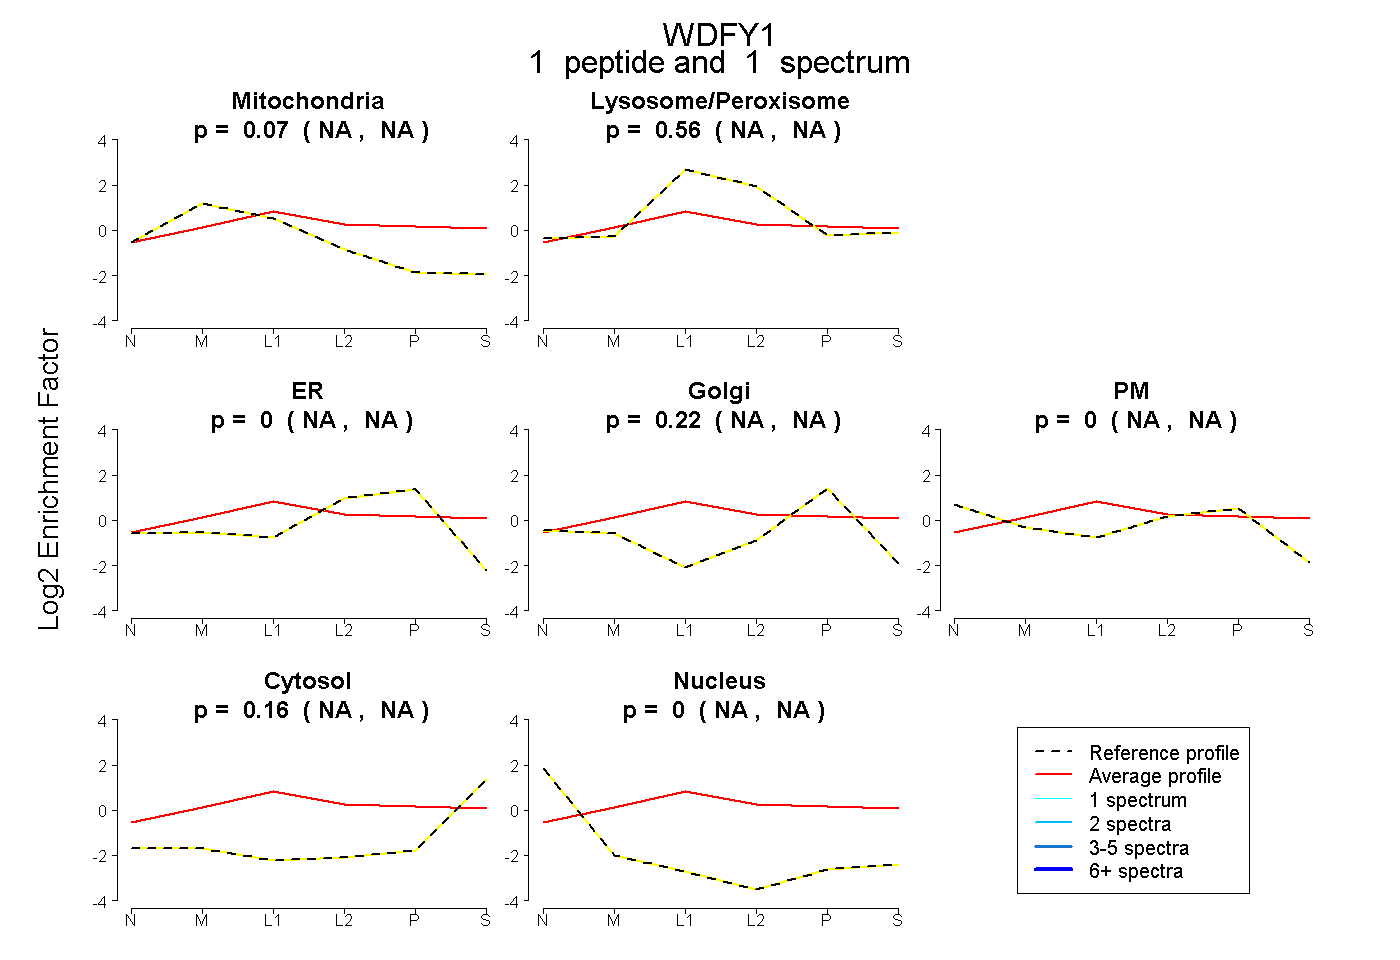 |
0.067 NA | NA |
0.562 NA | NA |
0.000 NA | NA |
0.216 NA | NA |
0.000 NA | NA |
0.155 NA | NA |
0.000 NA | NA |
|||
| Plot | Lyso | Other | |||||||||||
| Expt C |
1 peptide |
4 spectra |
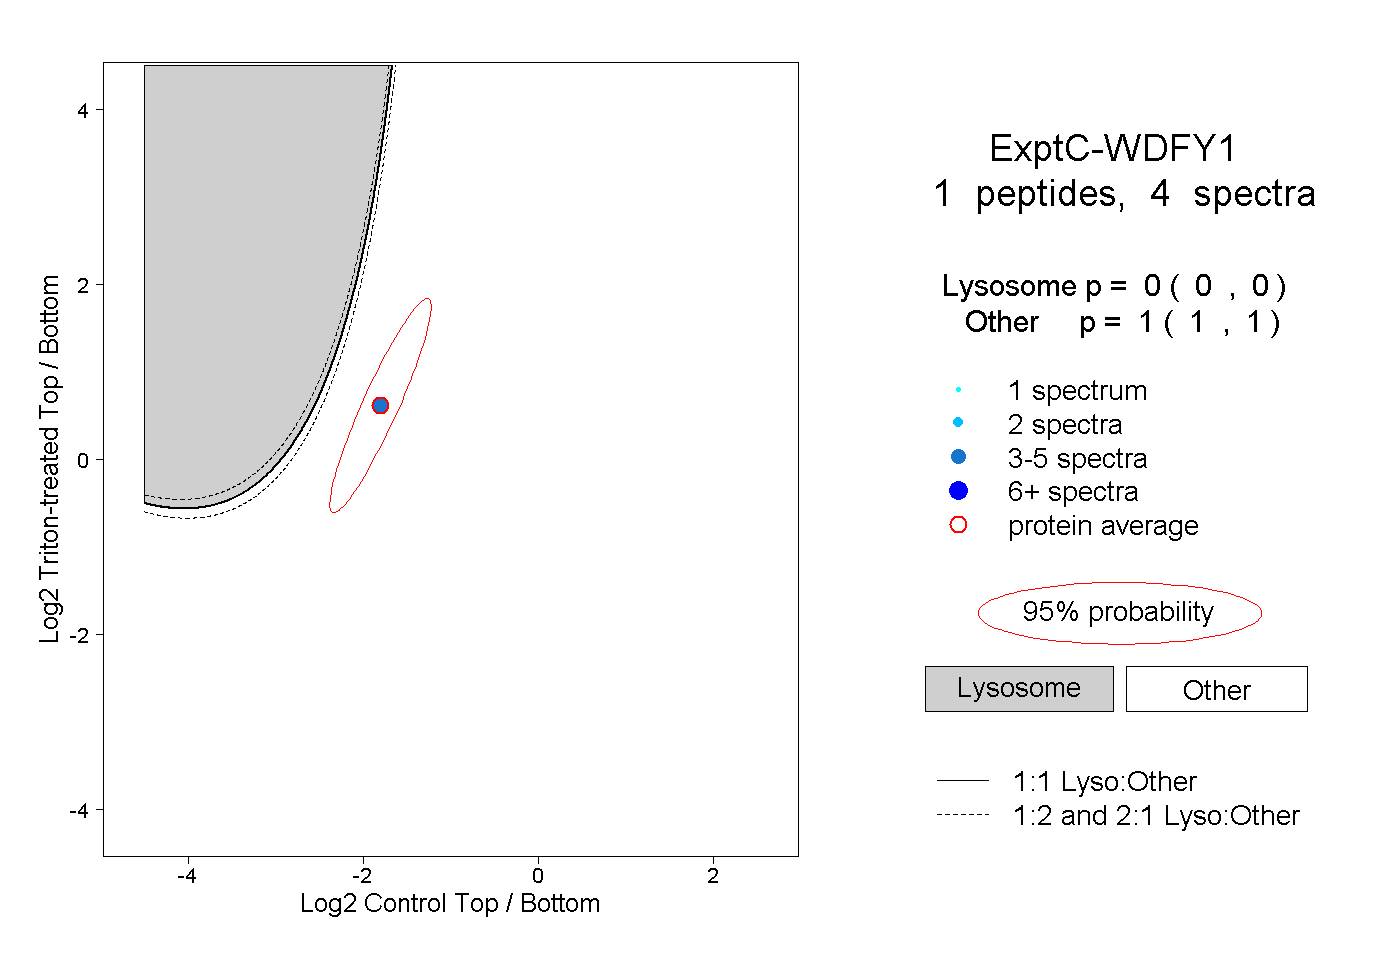 |
0.000 0.000 | 0.000 |
1.000 1.000 | 1.000 |