 12
12peptides
spectra
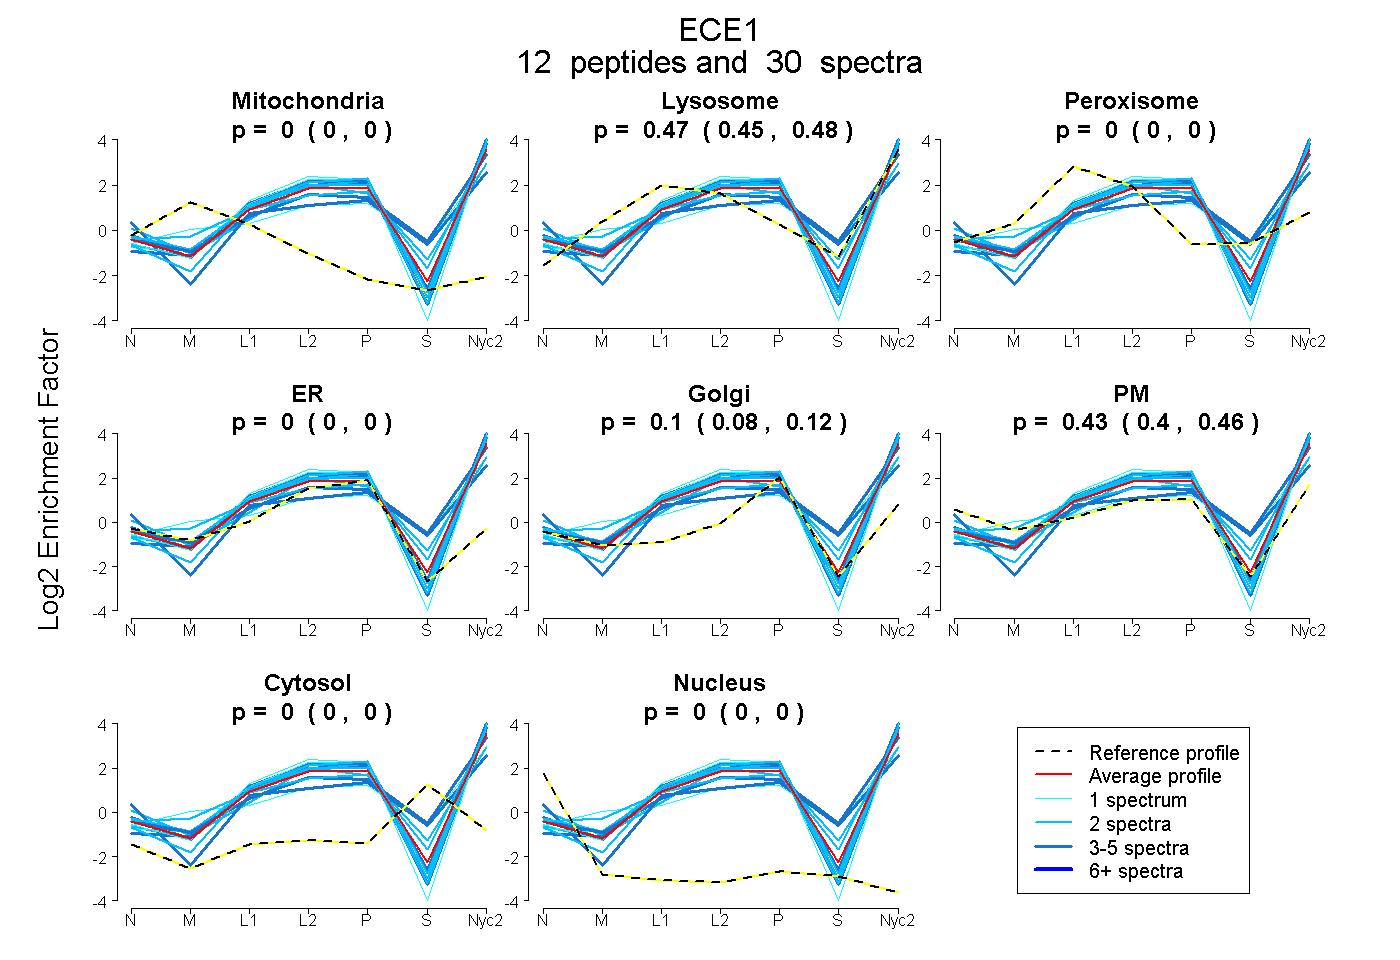
0.000 | 0.000
0.448 | 0.481
0.000 | 0.000
0.000 | 0.000
0.078 | 0.119
0.397 | 0.463
0.000 | 0.000
0.000 | 0.000
4peptides
spectra
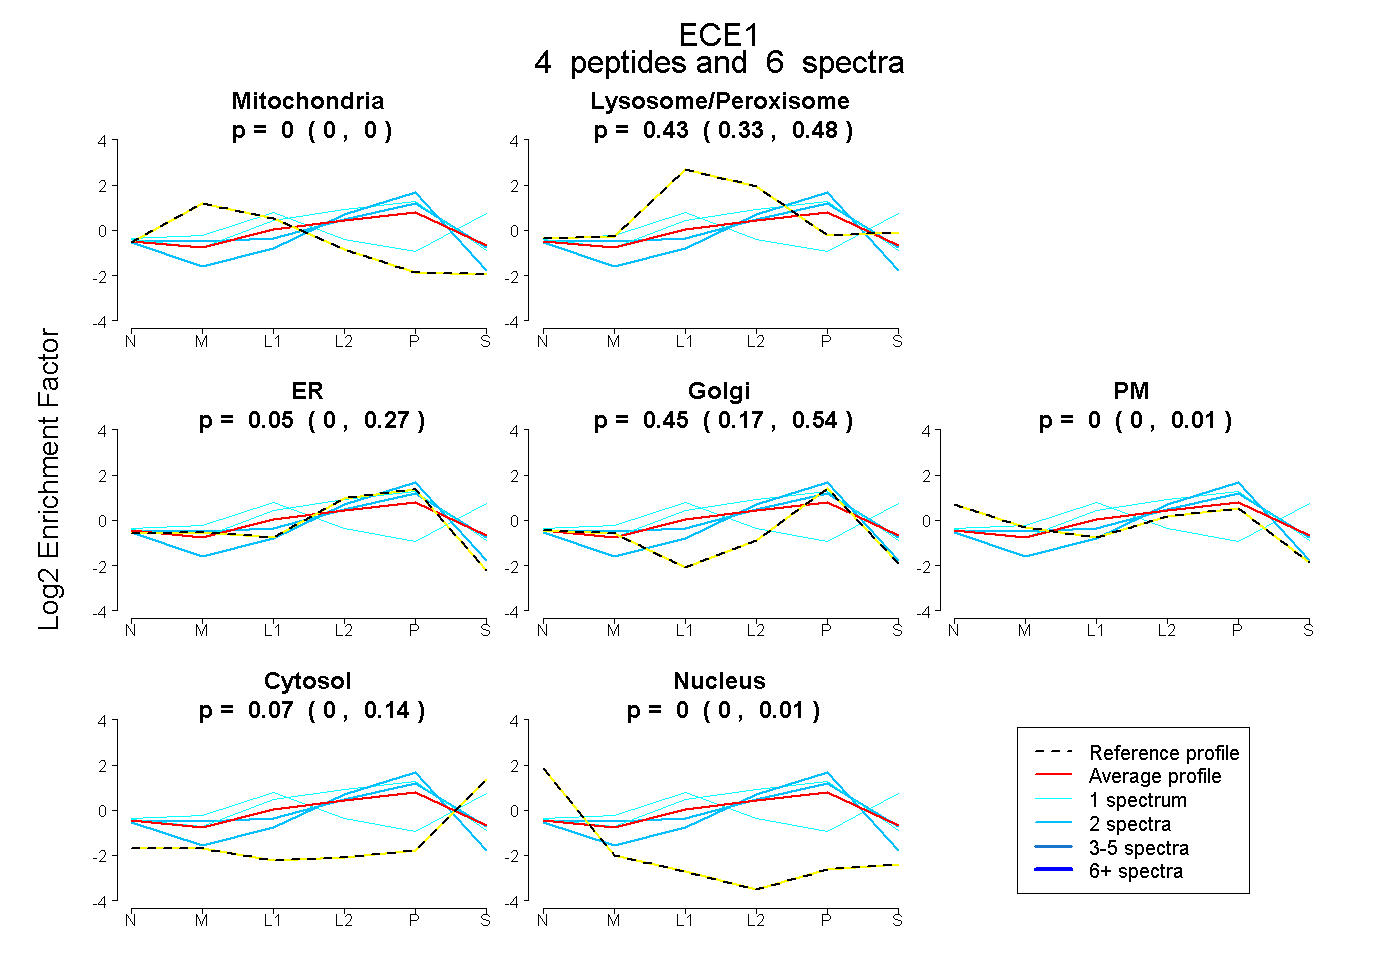
0.000 | 0.000
0.327 | 0.480
0.000 | 0.265
0.173 | 0.539
0.000 | 0.007
0.000 | 0.145
0.000 | 0.009
19peptides
spectra
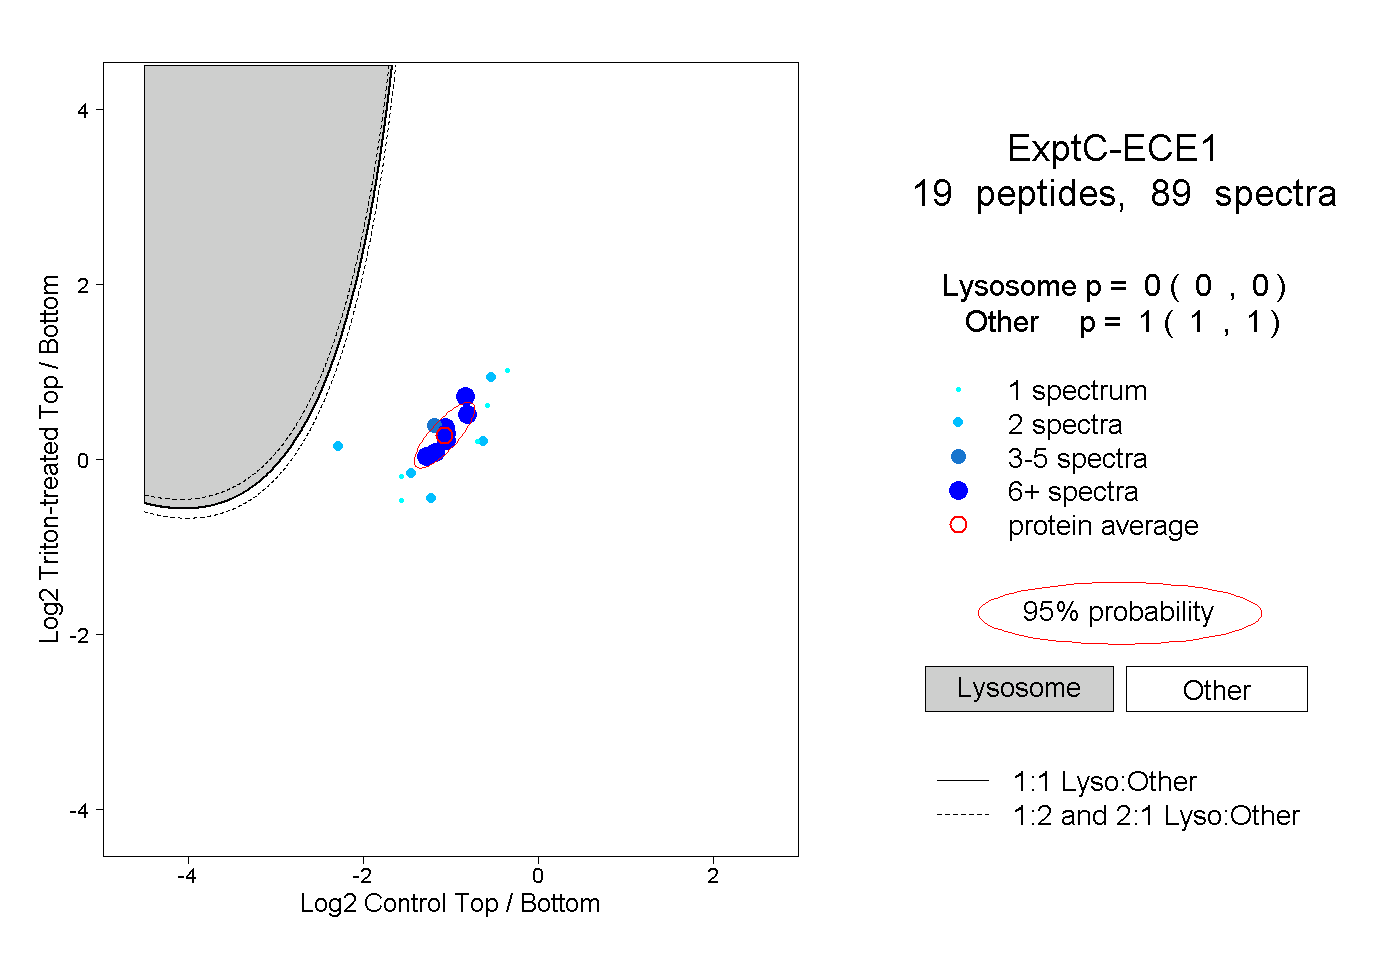
0.000 | 0.000
1.000 | 1.000
5peptides
spectra
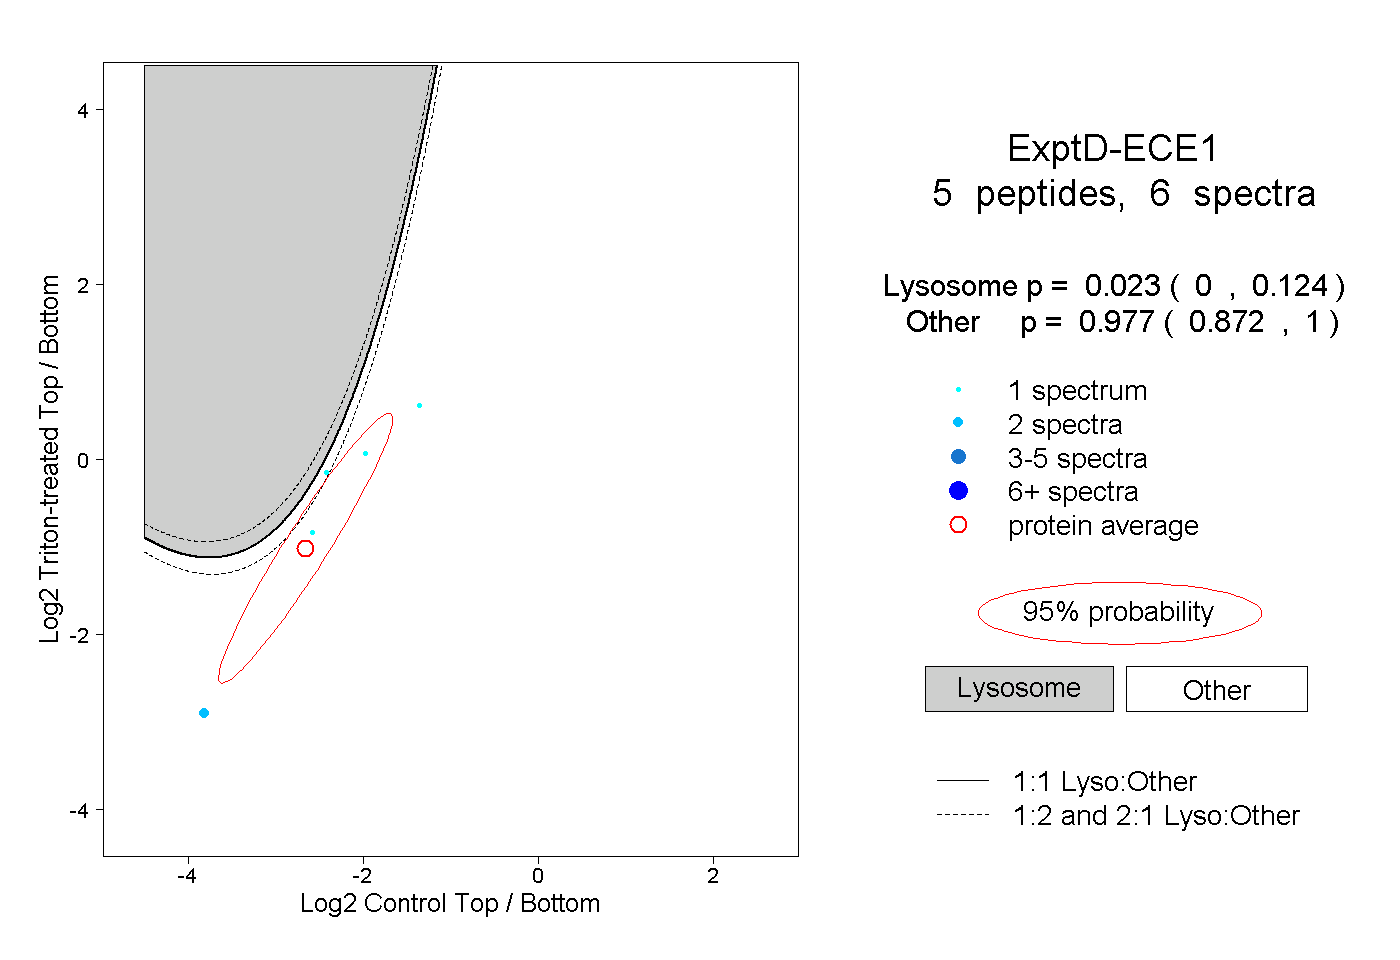
0.000 | 0.124
0.872 | 1.000