 12
12peptides
spectra
0.000 | 0.000
0.448 | 0.481
0.000 | 0.000
0.000 | 0.000
0.078 | 0.119
0.397 | 0.463
0.000 | 0.000
0.000 | 0.000
| Plot | Mito | Lyso | Perox | ER | Golgi | PM | Cytosol | Nucleus | |||||
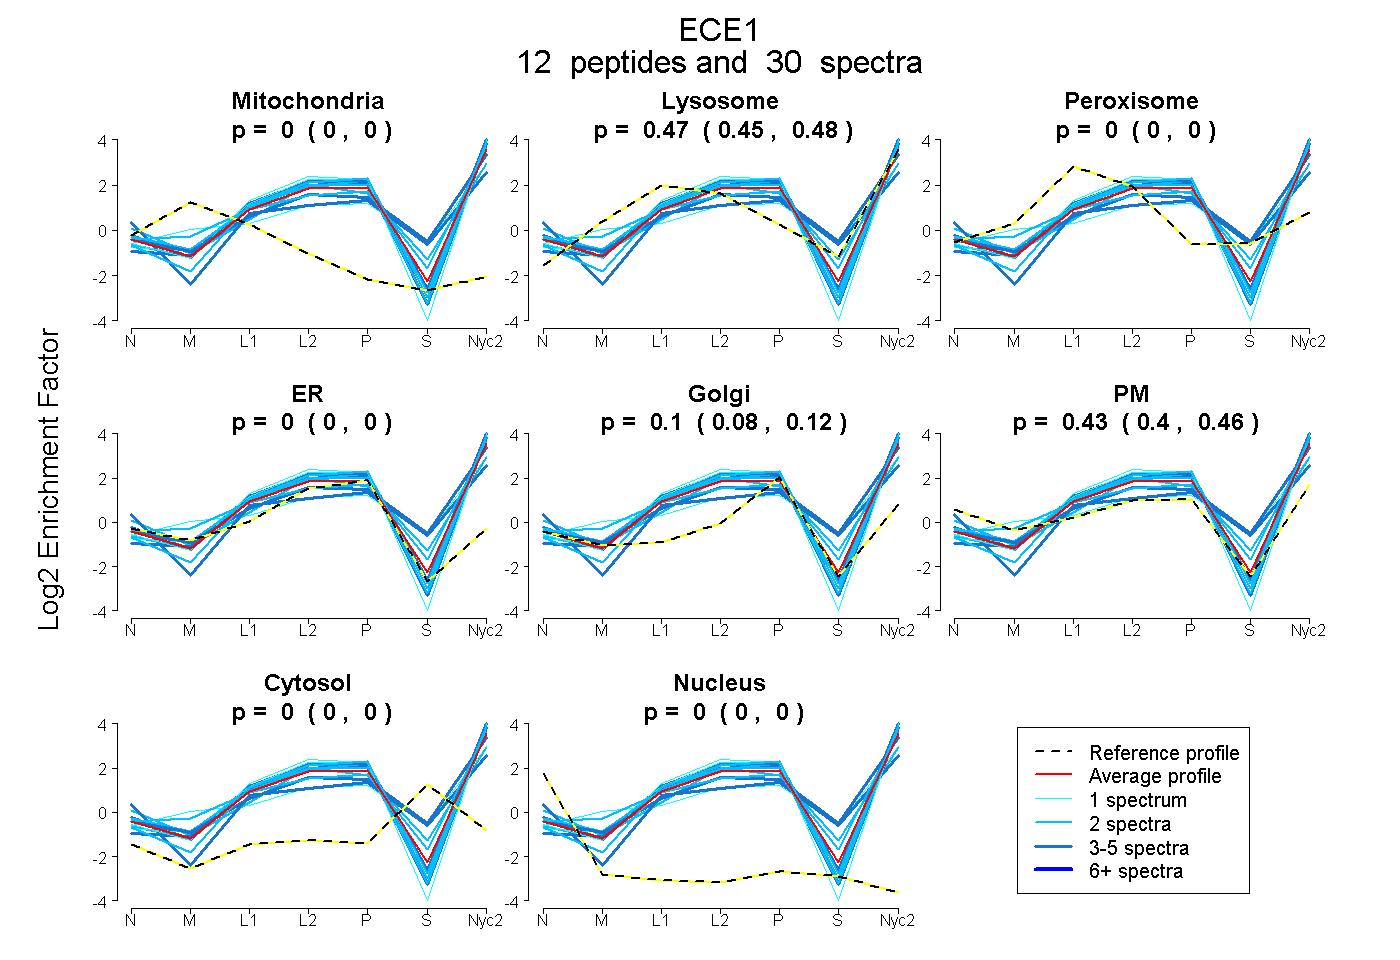
| Expt A |
12 peptides |
30 spectra |
|
0.000 0.000 | 0.000 |
0.466 0.448 | 0.481 |
0.000 0.000 | 0.000 |
0.000 0.000 | 0.000 |
0.101 0.078 | 0.119 |
0.433 0.397 | 0.463 |
0.000 0.000 | 0.000 |
0.000 0.000 | 0.000 |
| 4 spectra, EFSEHFR | 0.000 | 0.258 | 0.000 | 0.000 | 0.000 | 0.564 | 0.178 | 0.000 | ||
| 2 spectra, AQVYYR | 0.000 | 0.367 | 0.000 | 0.000 | 0.065 | 0.568 | 0.000 | 0.000 | ||
| 2 spectra, NEIVFPAGILQAPFYTR | 0.000 | 0.404 | 0.000 | 0.000 | 0.000 | 0.596 | 0.000 | 0.000 | ||
| 2 spectra, AYQNWVK | 0.000 | 0.497 | 0.000 | 0.000 | 0.082 | 0.421 | 0.000 | 0.000 | ||
| 4 spectra, ATFAEDSK | 0.000 | 0.376 | 0.000 | 0.000 | 0.000 | 0.624 | 0.000 | 0.000 | ||
| 4 spectra, TSSFLDQR | 0.000 | 0.609 | 0.000 | 0.000 | 0.192 | 0.163 | 0.036 | 0.000 | ||
| 1 spectrum, FQDADEK | 0.000 | 0.431 | 0.000 | 0.022 | 0.000 | 0.547 | 0.000 | 0.000 | ||
| 2 spectra, VTADQLR | 0.000 | 0.498 | 0.000 | 0.000 | 0.173 | 0.329 | 0.000 | 0.000 | ||
| 5 spectra, CPLGSPMNPR | 0.000 | 0.610 | 0.000 | 0.000 | 0.157 | 0.233 | 0.000 | 0.000 | ||
| 2 spectra, WMDEDTR | 0.000 | 0.562 | 0.000 | 0.000 | 0.086 | 0.352 | 0.000 | 0.000 | ||
| 1 spectrum, AKPLMELIEK | 0.000 | 0.593 | 0.000 | 0.000 | 0.237 | 0.113 | 0.057 | 0.000 | ||
| 1 spectrum, HTLGENIADNGGLK | 0.000 | 0.407 | 0.000 | 0.005 | 0.000 | 0.588 | 0.000 | 0.000 |
| Plot | Mito | Lyso or Perox | ER | Golgi | PM | Cytosol | Nucleus | ||||||
| Expt B |
4 peptides |
6 spectra |
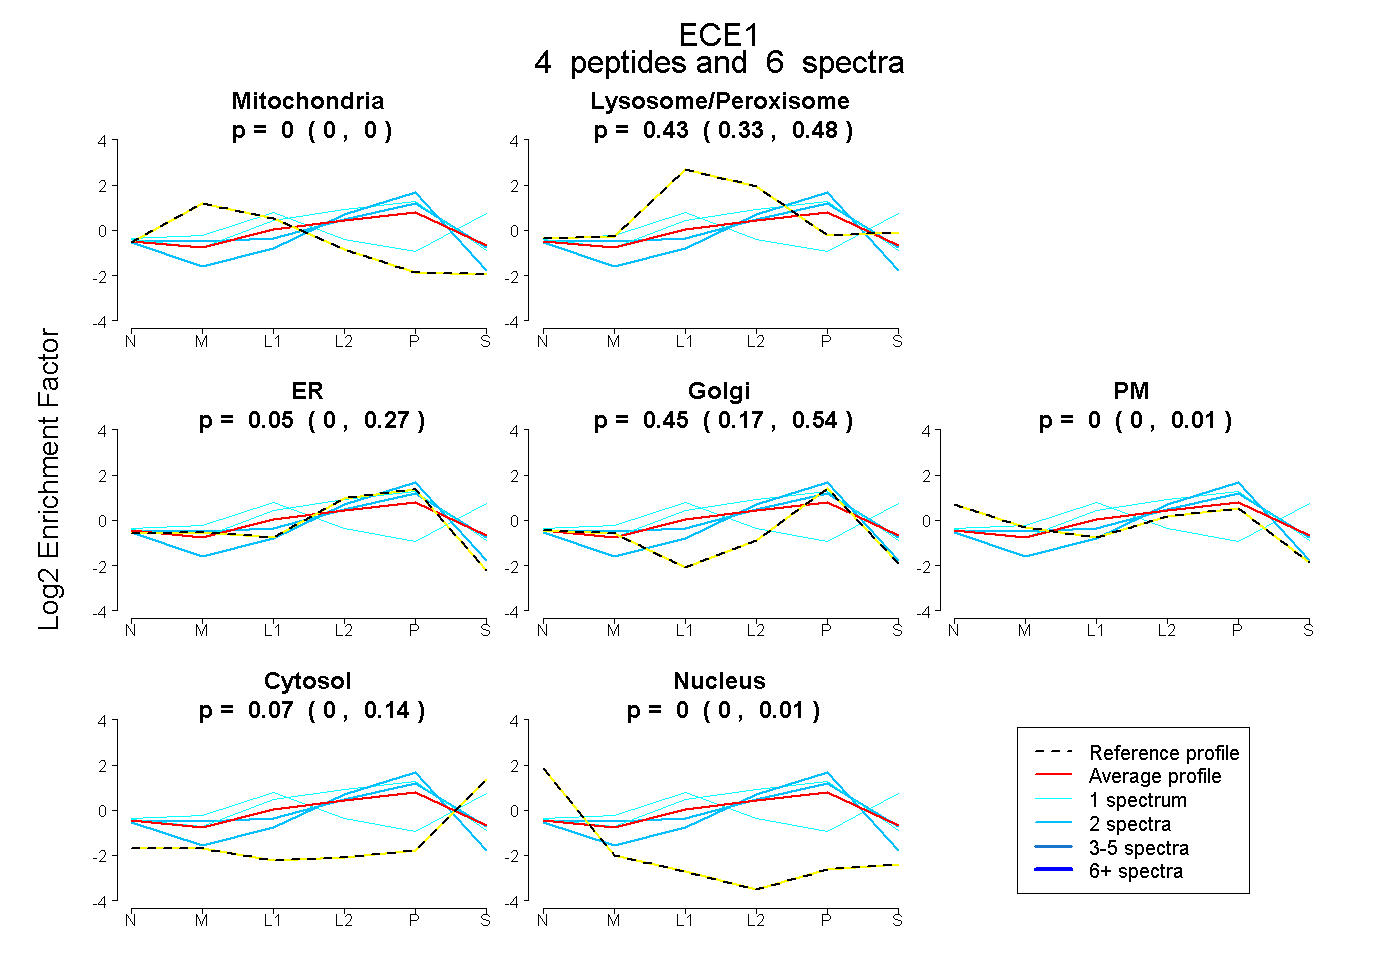 |
0.000 0.000 | 0.000 |
0.434 0.327 | 0.480 |
0.048 0.000 | 0.265 |
0.452 0.173 | 0.539 |
0.000 0.000 | 0.007 |
0.066 0.000 | 0.145 |
0.000 0.000 | 0.009 |
|||
| Plot | Lyso | Other | |||||||||||
| Expt C |
19 peptides |
89 spectra |
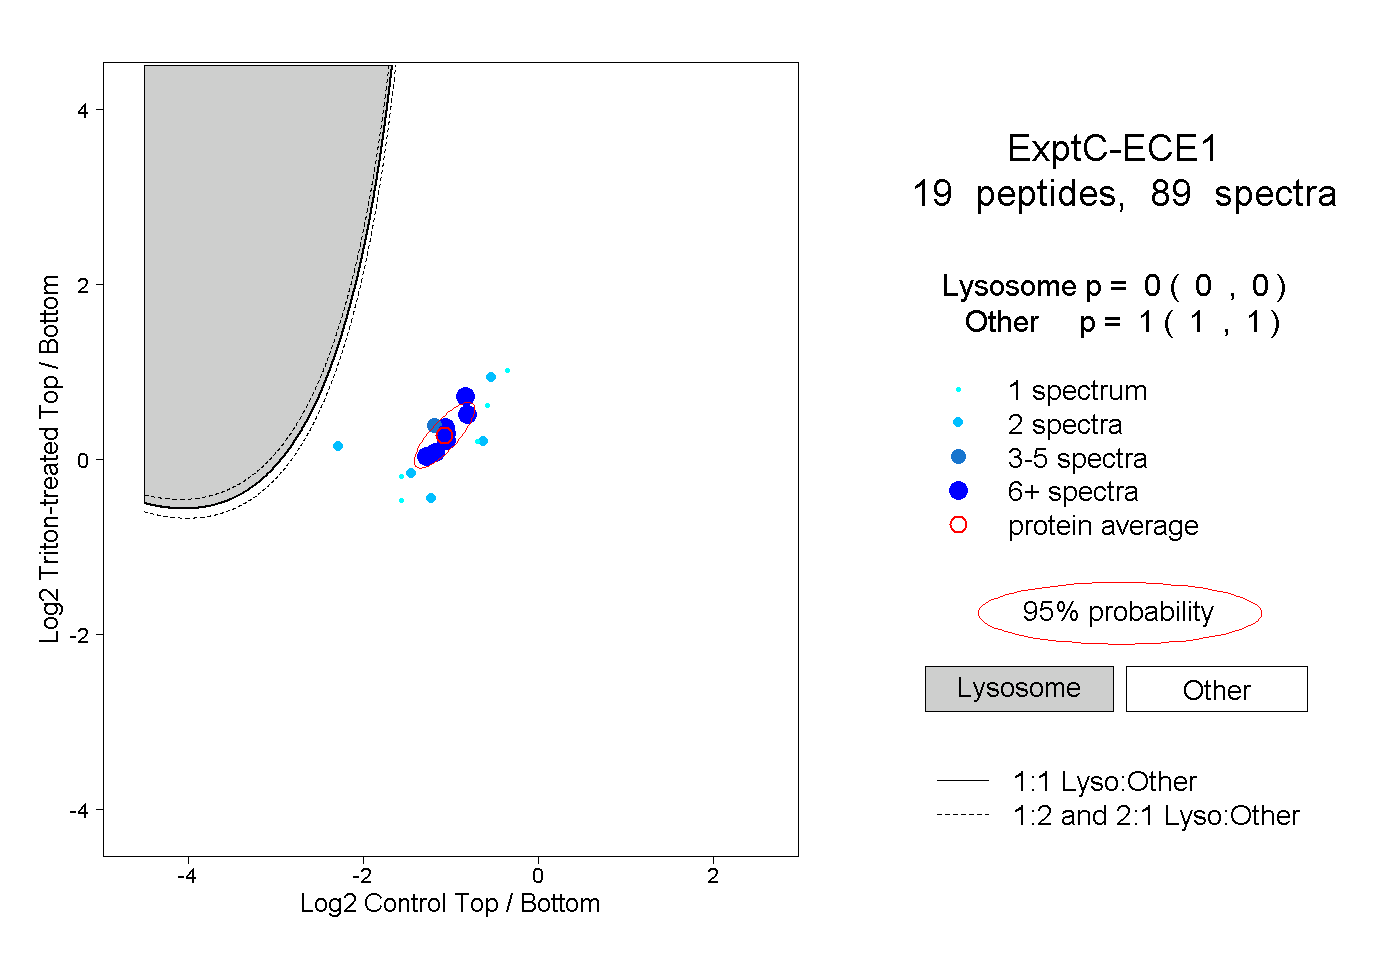 |
0.000 0.000 | 0.000 |
1.000 1.000 | 1.000 |
||||||||
| Plot | Lyso | Other | |||||||||||
| Expt D |
5 peptides |
6 spectra |
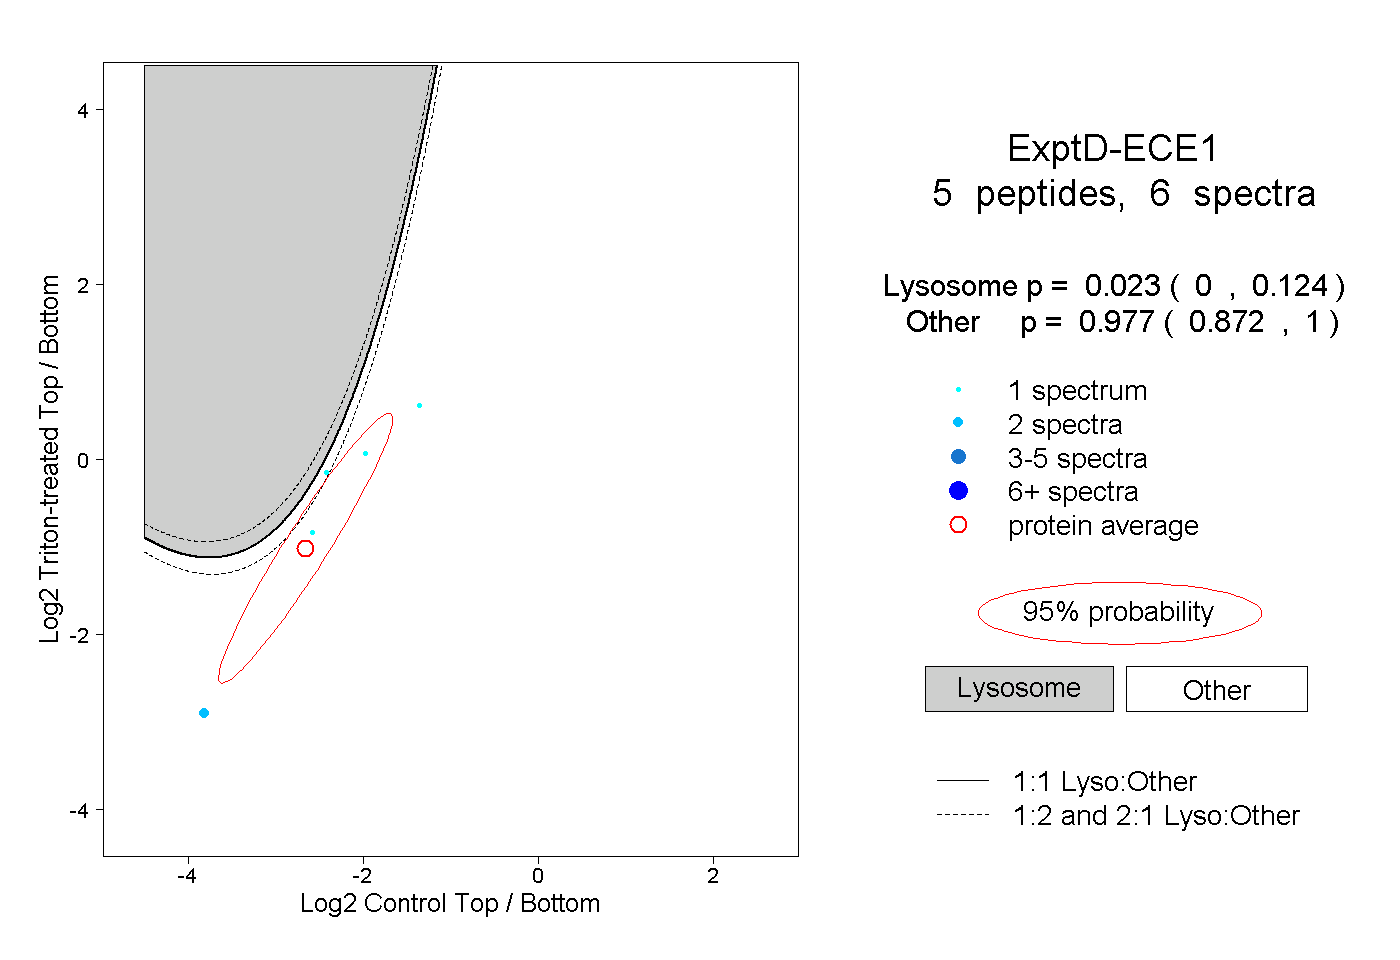 |
0.023 0.000 | 0.124 |
0.977 0.872 | 1.000 |