 3
3peptides
spectra
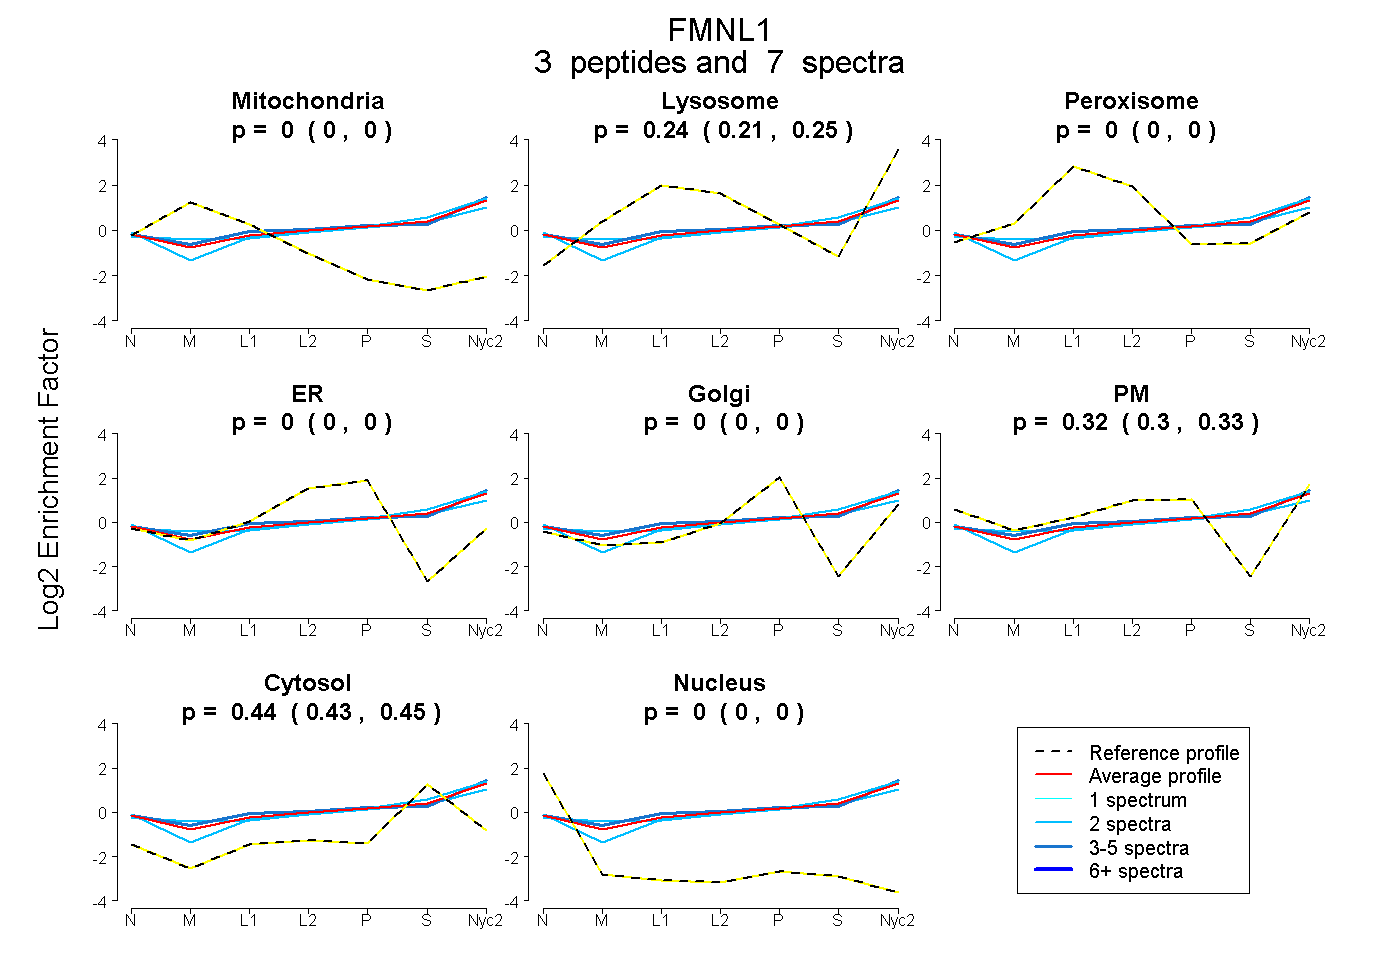
0.000 | 0.000
0.215 | 0.253
0.000 | 0.000
0.000 | 0.000
0.000 | 0.000
0.304 | 0.335
0.430 | 0.455
0.000 | 0.000
2peptides
spectra
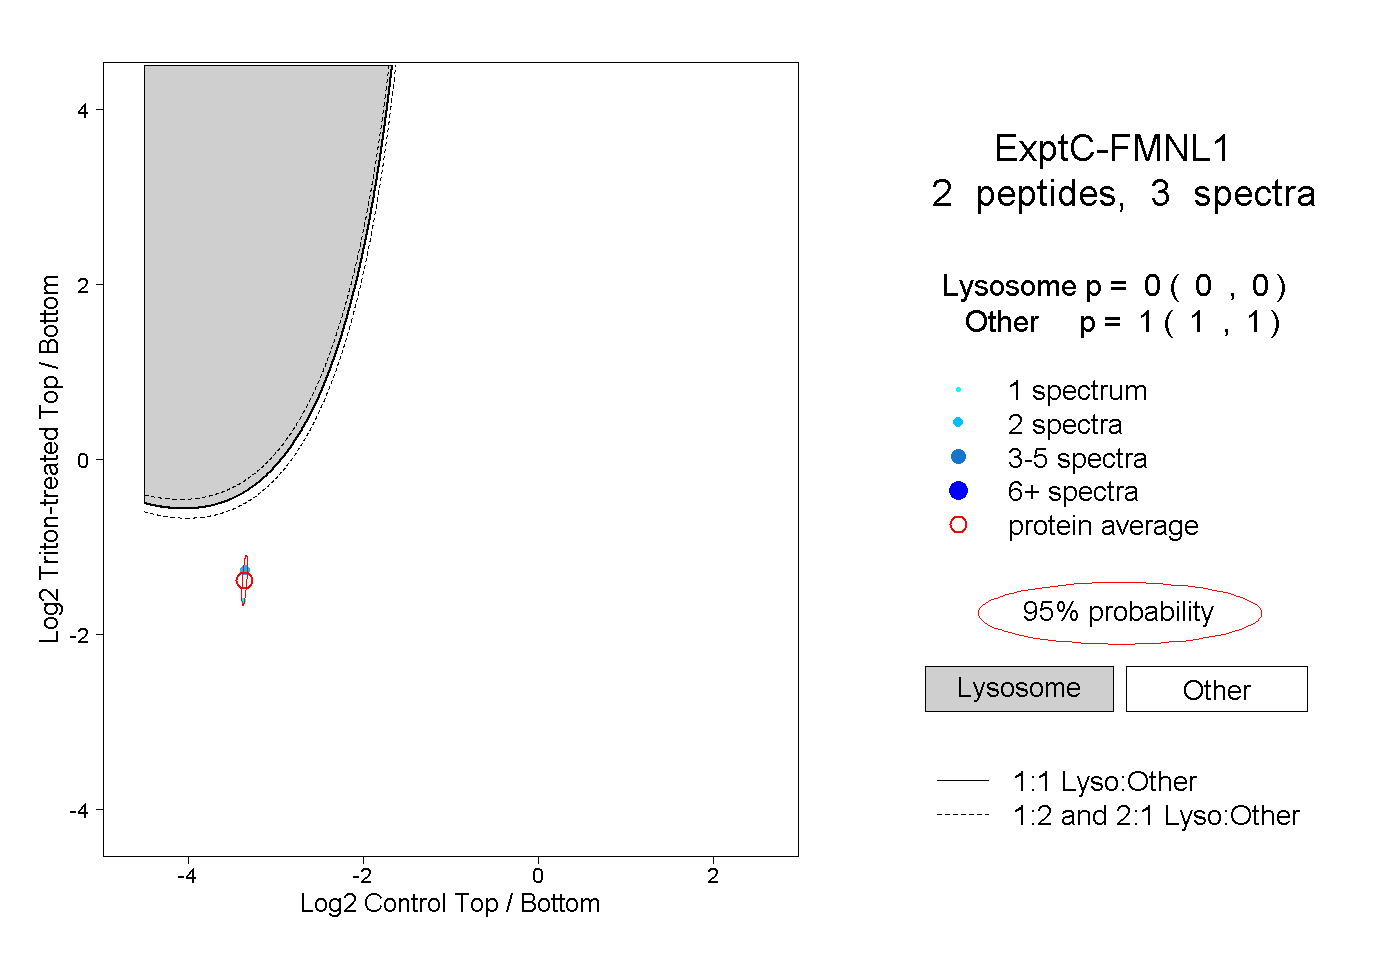
0.000 | 0.000
1.000 | 1.000
1peptide
spectrum
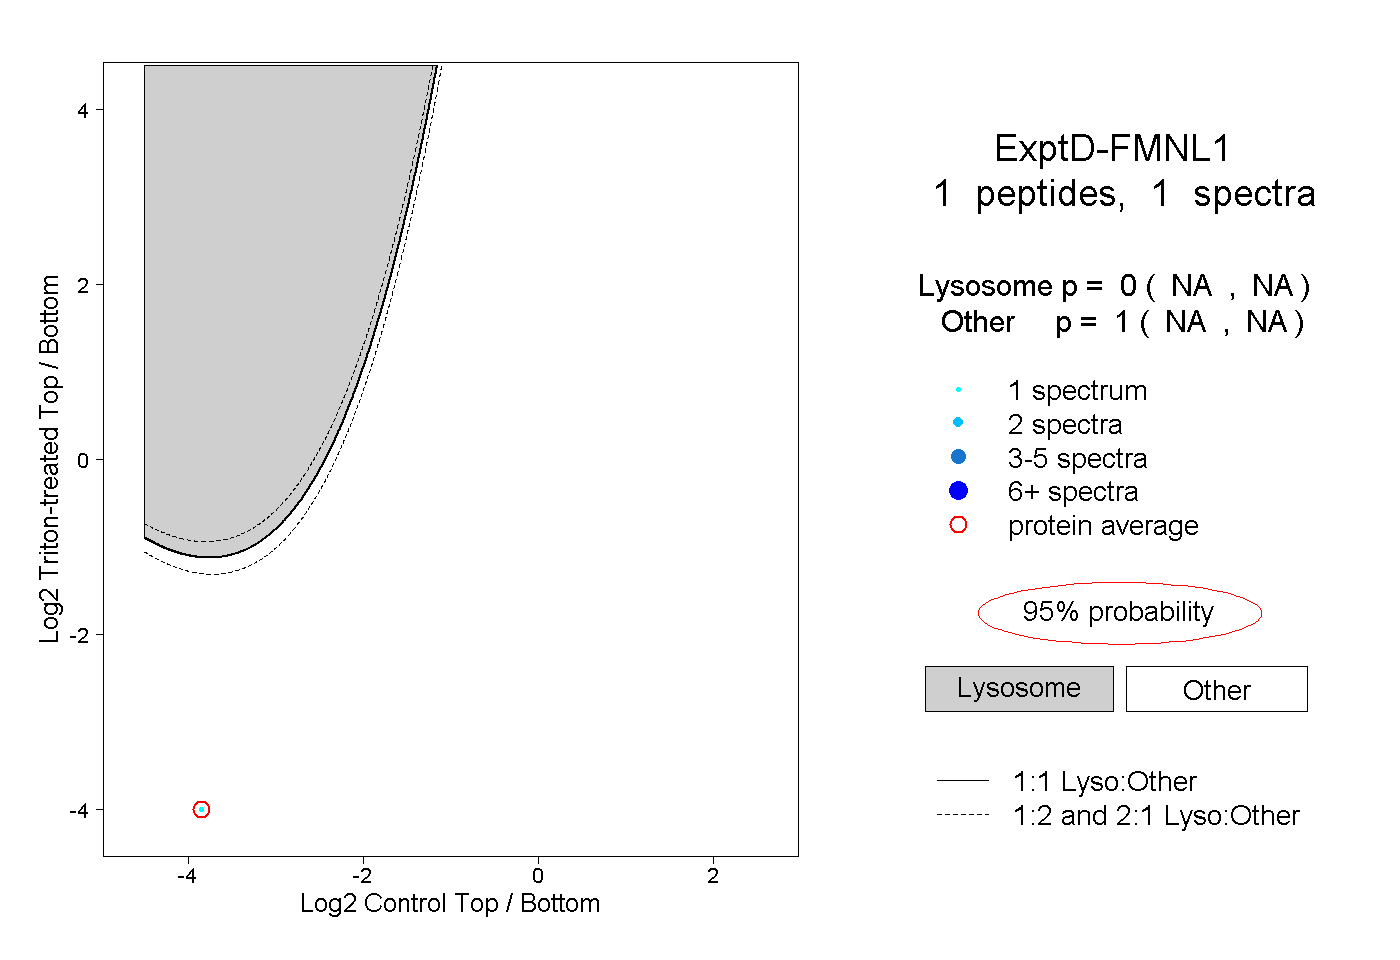
NA | NA
NA | NA