 3
3peptides
spectra
0.000 | 0.000
0.215 | 0.253
0.000 | 0.000
0.000 | 0.000
0.000 | 0.000
0.304 | 0.335
0.430 | 0.455
0.000 | 0.000
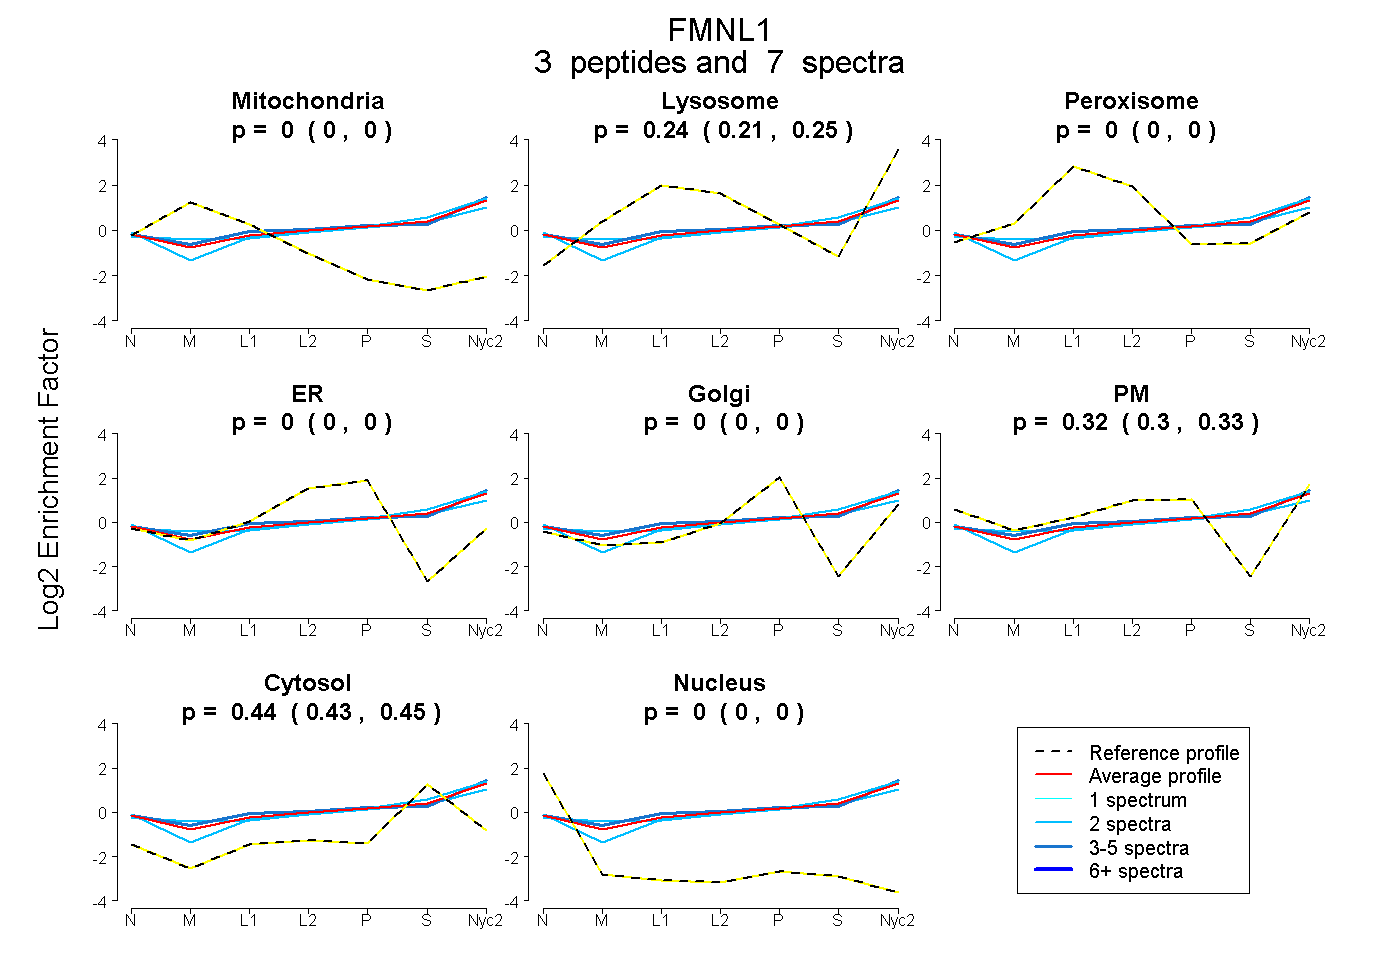
| Plot | Mito | Lyso | Perox | ER | Golgi | PM | Cytosol | Nucleus | |||||
| Expt A |
3 peptides |
7 spectra |
|
0.000 0.000 | 0.000 |
0.235 0.215 | 0.253 |
0.000 0.000 | 0.000 |
0.000 0.000 | 0.000 |
0.000 0.000 | 0.000 |
0.321 0.304 | 0.335 |
0.443 0.430 | 0.455 |
0.000 0.000 | 0.000 |
| 2 spectra, VEELEEK | 0.000 | 0.211 | 0.000 | 0.000 | 0.000 | 0.306 | 0.483 | 0.000 | ||
| 3 spectra, LQSLDALLEMK | 0.000 | 0.274 | 0.000 | 0.000 | 0.000 | 0.322 | 0.404 | 0.000 | ||
| 2 spectra, IAELEK | 0.000 | 0.197 | 0.018 | 0.000 | 0.000 | 0.329 | 0.456 | 0.000 |
| Plot | Lyso | Other | |||||||||||
| Expt C |
2 peptides |
3 spectra |
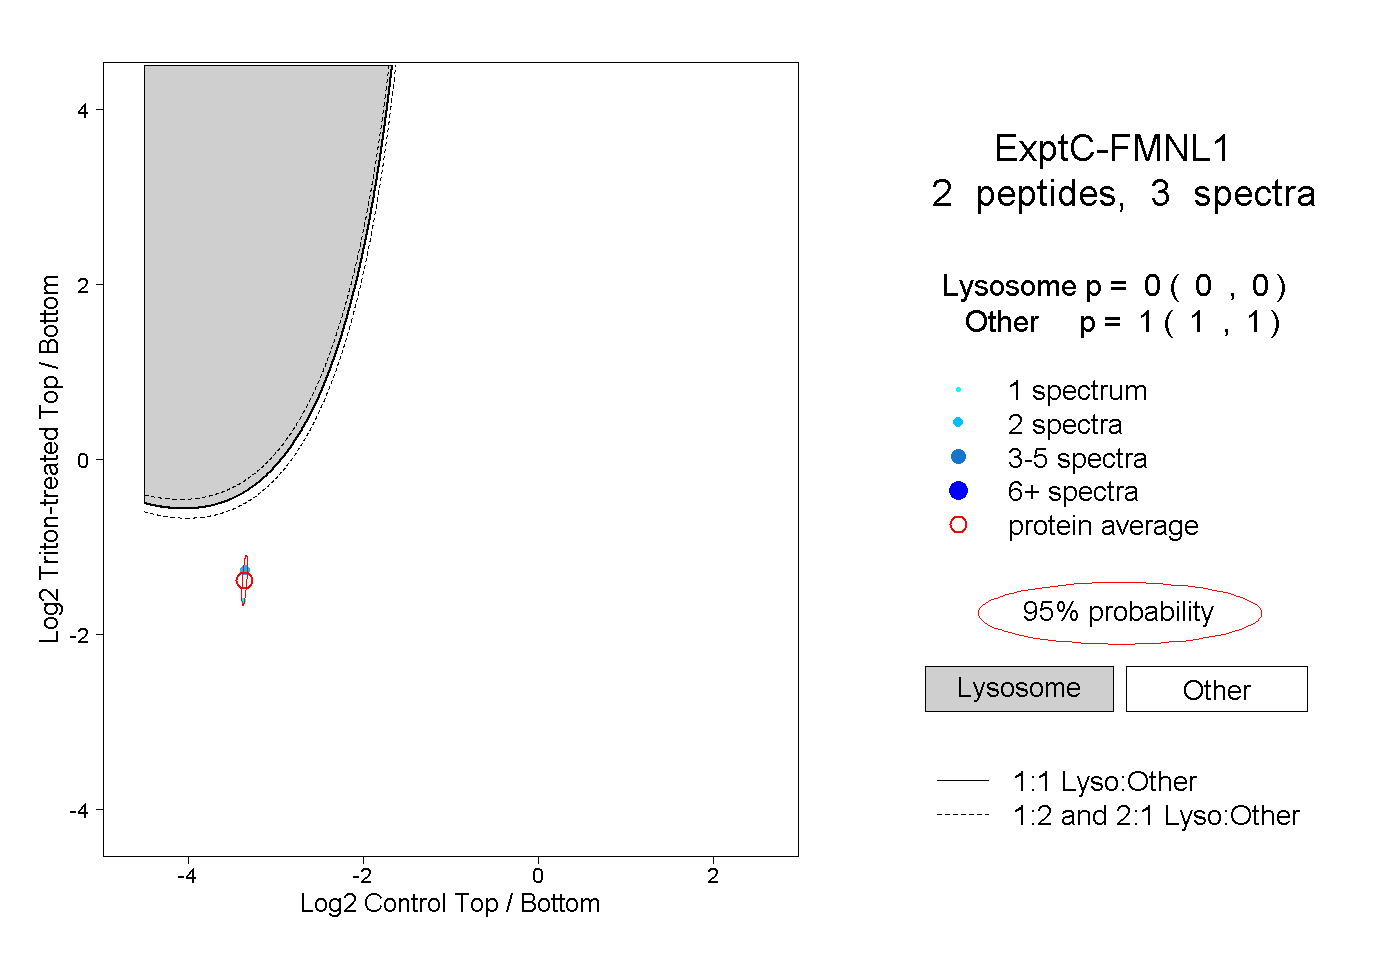 |
0.000 0.000 | 0.000 |
1.000 1.000 | 1.000 |
||||||||
| Plot | Lyso | Other | |||||||||||
| Expt D |
1 peptide |
1 spectrum |
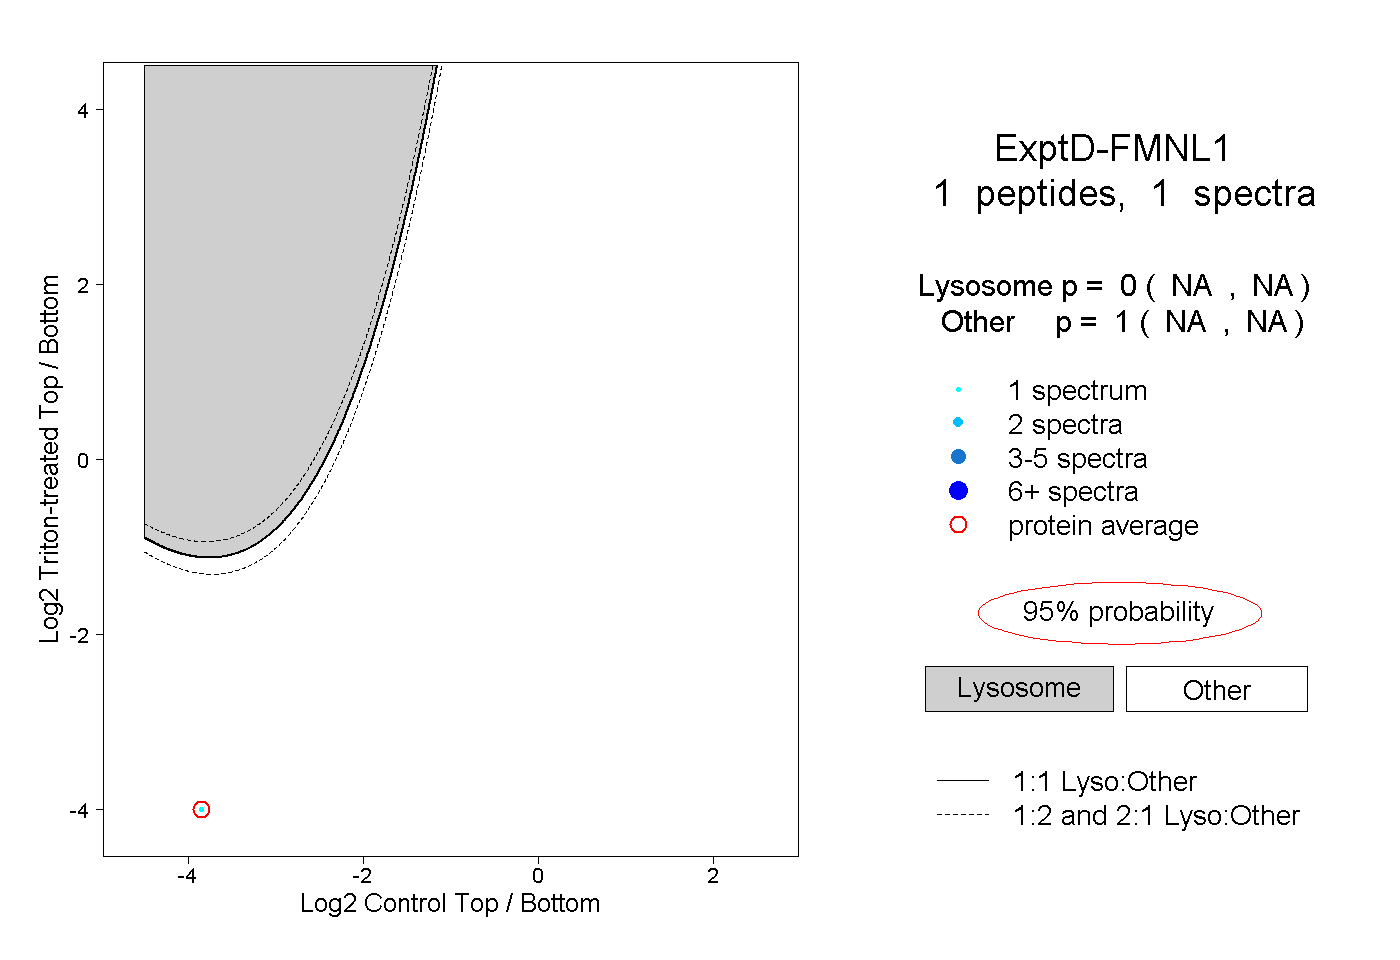 |
0.000 NA | NA |
1.000 NA | NA |