 13
13peptides
spectra
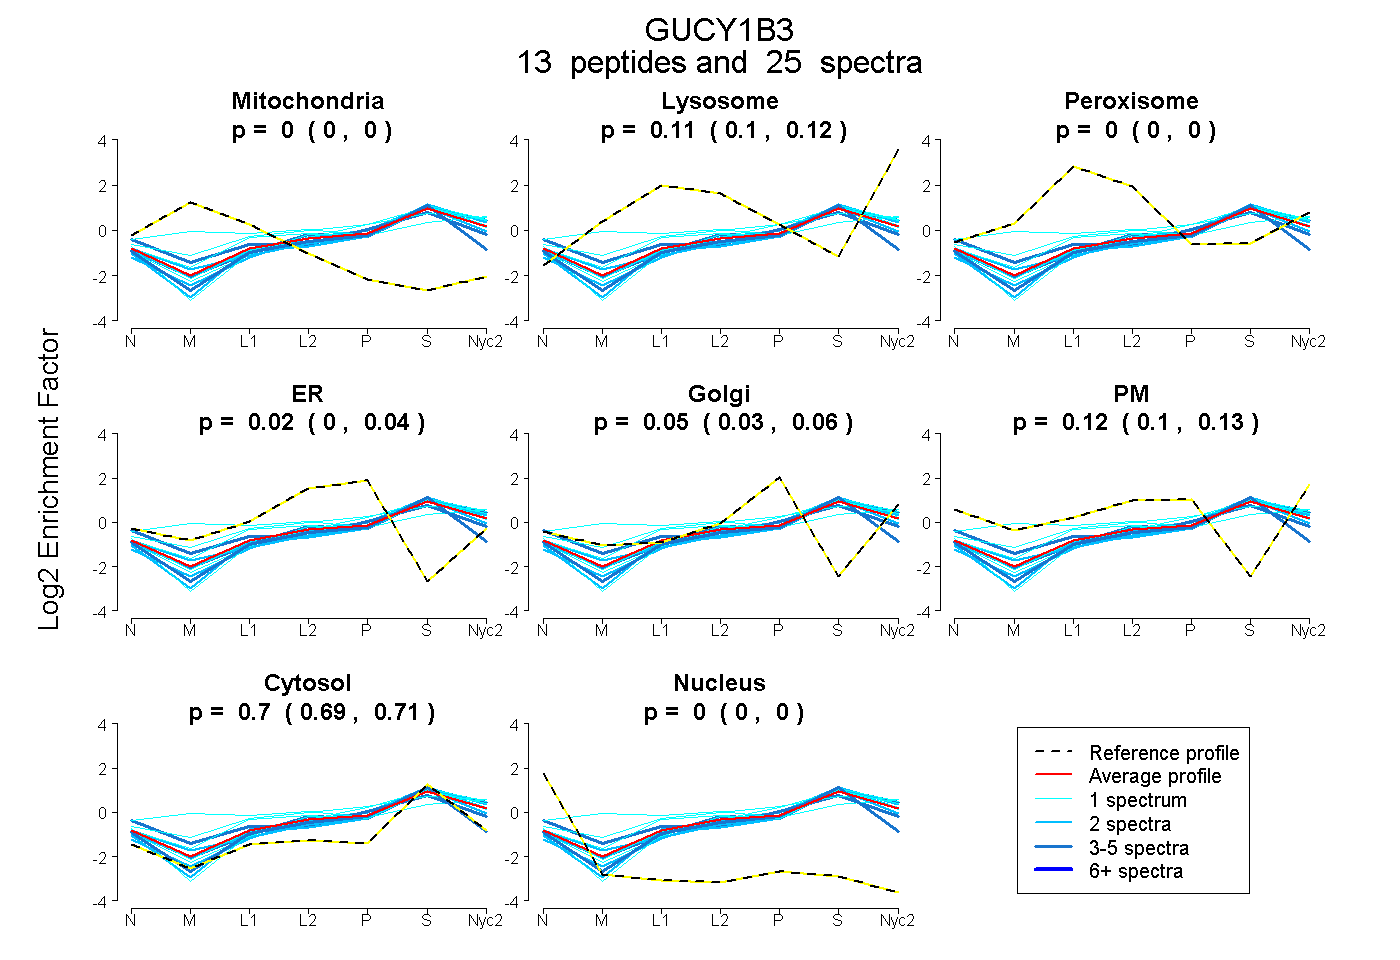
0.000 | 0.000
0.104 | 0.123
0.000 | 0.005
0.002 | 0.036
0.028 | 0.060
0.100 | 0.132
0.694 | 0.706
0.000 | 0.000
2peptides
spectra
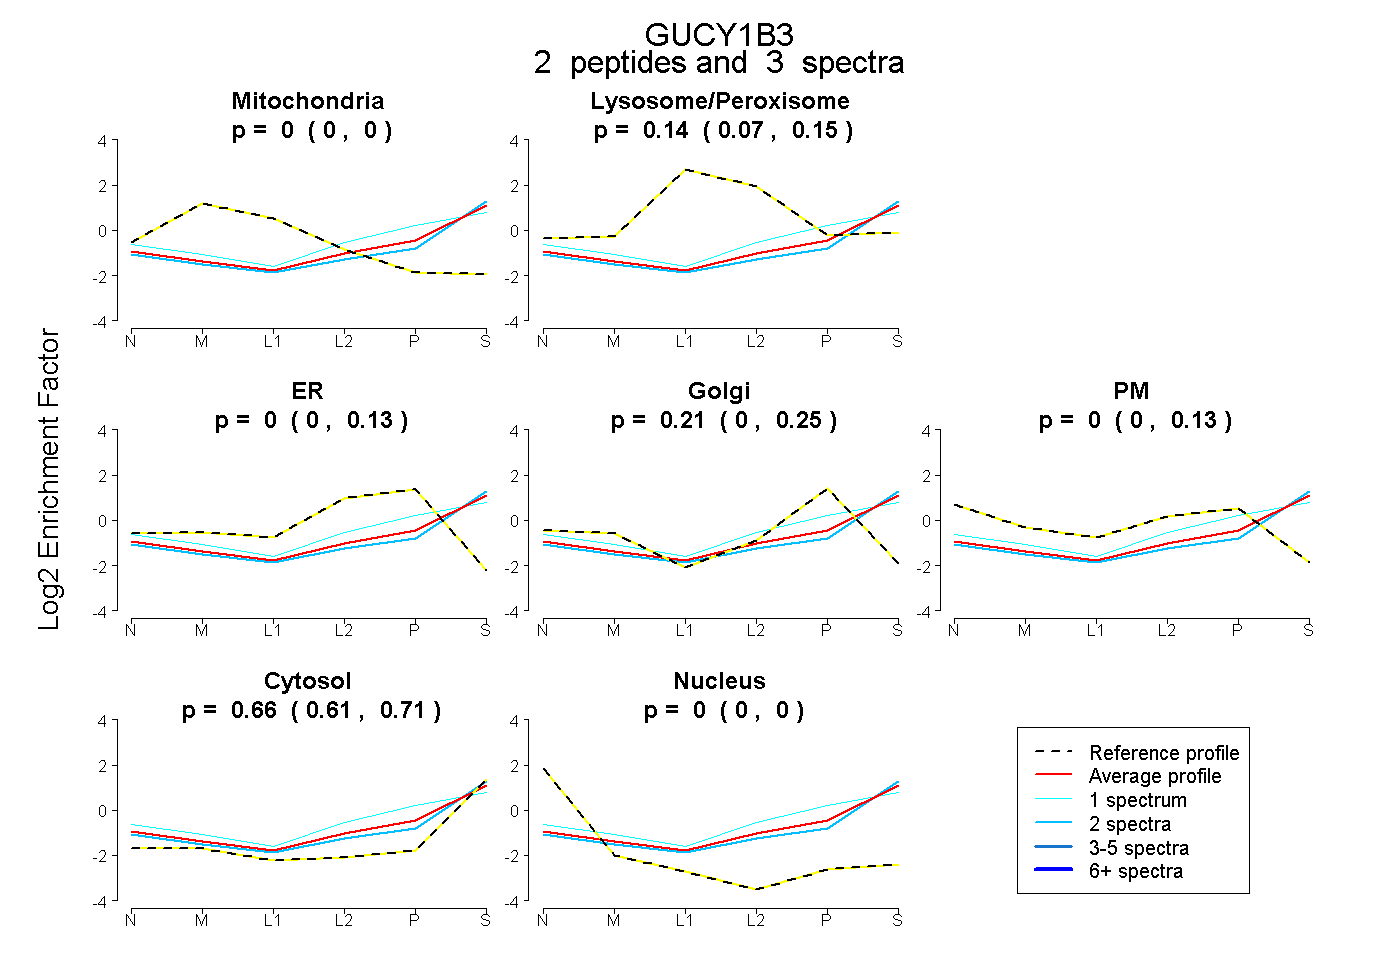
0.000 | 0.000
0.069 | 0.149
0.000 | 0.133
0.000 | 0.254
0.000 | 0.131
0.606 | 0.715
0.000 | 0.000
11peptides
spectra
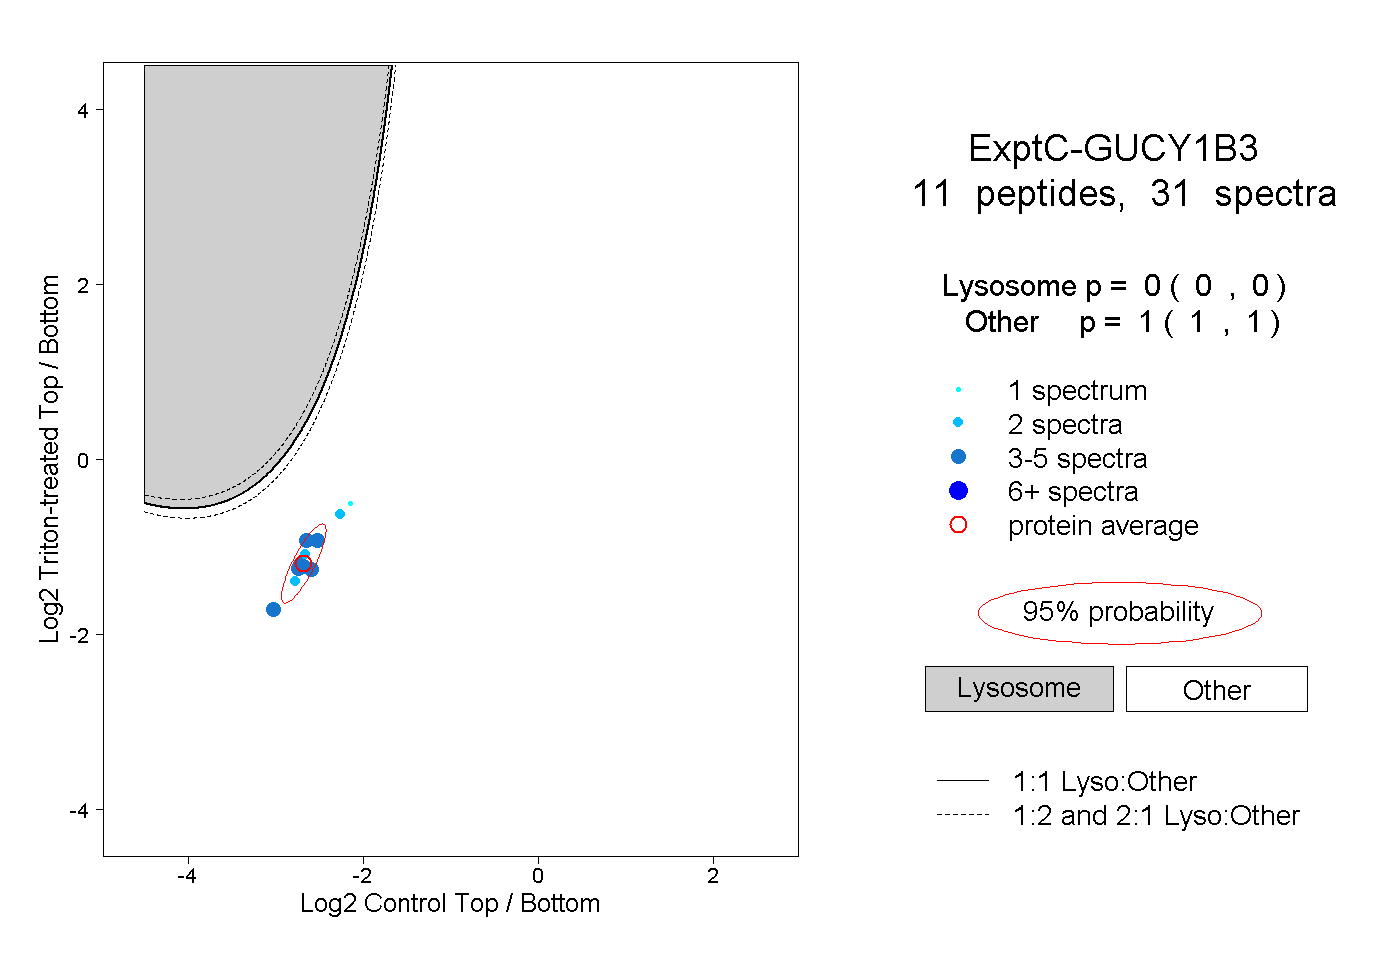
0.000 | 0.000
1.000 | 1.000
1peptide
spectra
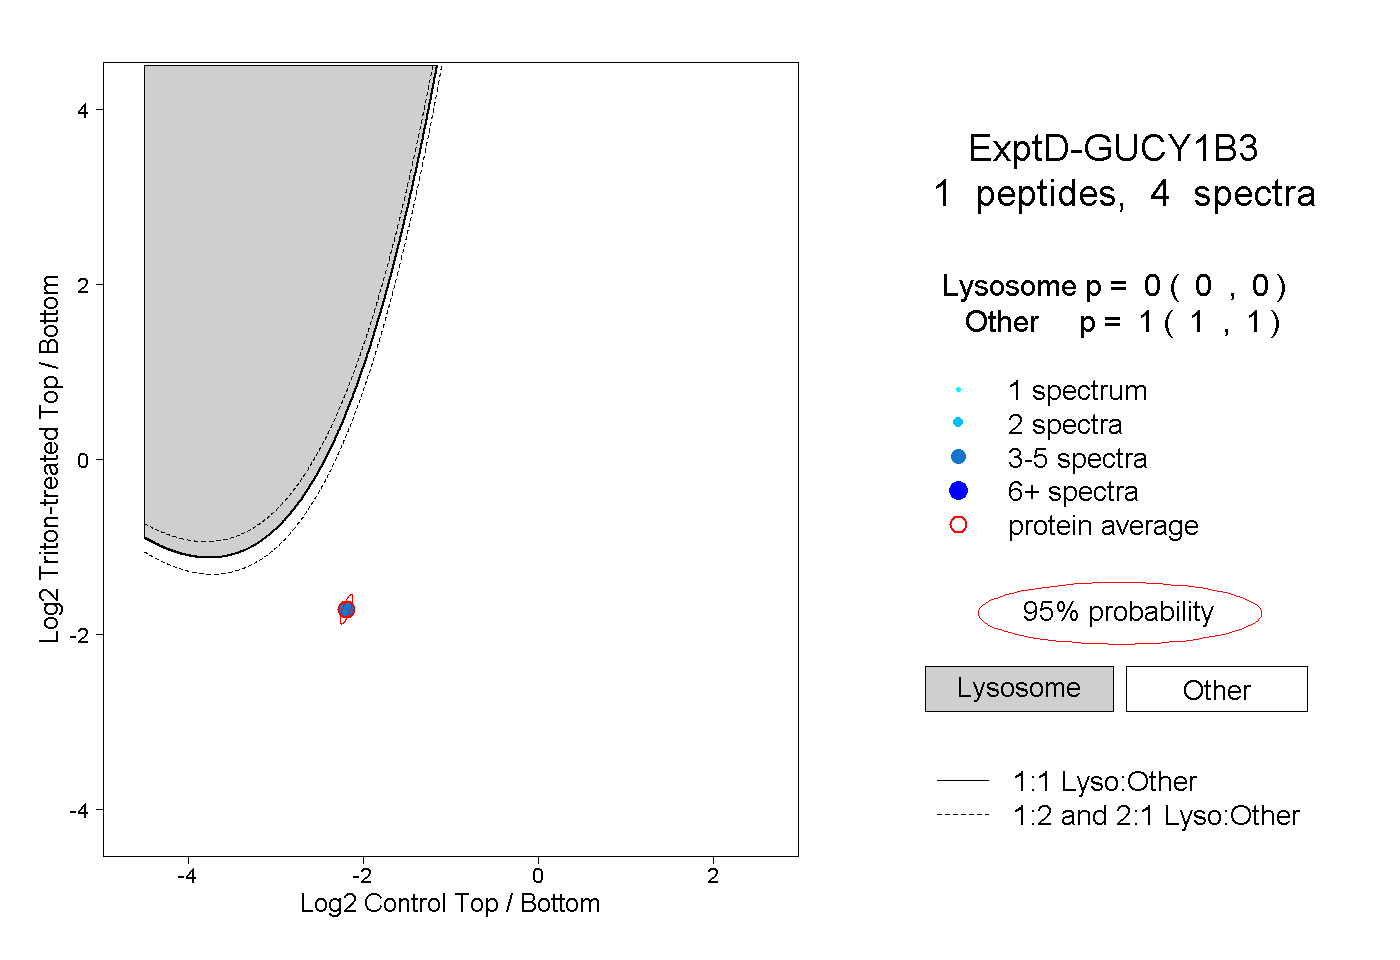
0.000 | 0.000
1.000 | 1.000