 13
13peptides
spectra
0.000 | 0.000
0.104 | 0.123
0.000 | 0.005
0.002 | 0.036
0.028 | 0.060
0.100 | 0.132
0.694 | 0.706
0.000 | 0.000
| Plot | Mito | Lyso | Perox | ER | Golgi | PM | Cytosol | Nucleus | |||||
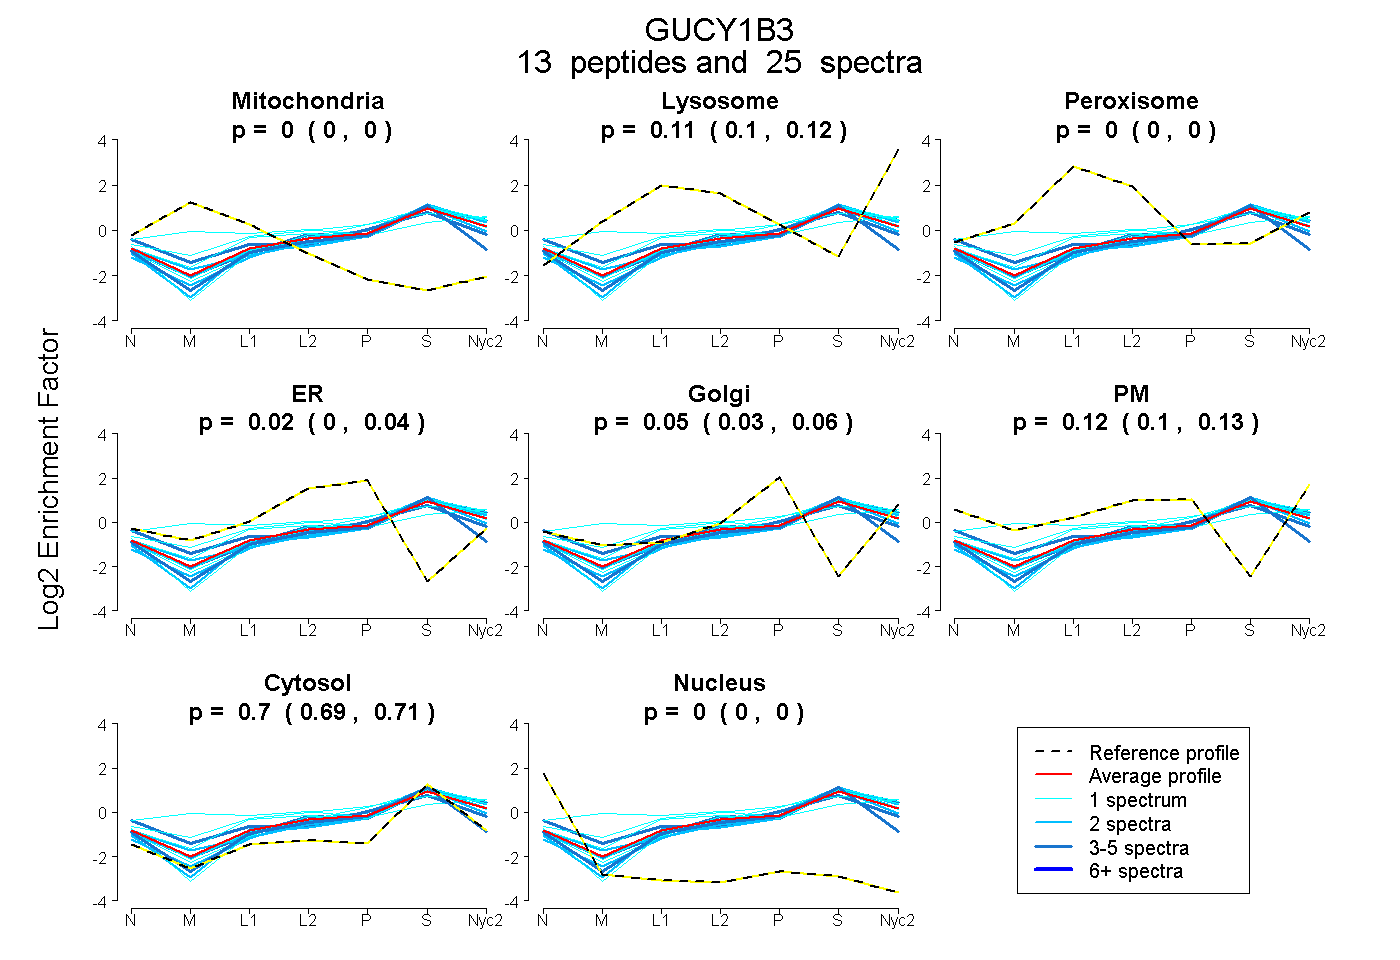
| Expt A |
13 peptides |
25 spectra |
|
0.000 0.000 | 0.000 |
0.114 0.104 | 0.123 |
0.000 0.000 | 0.005 |
0.021 0.002 | 0.036 |
0.045 0.028 | 0.060 |
0.118 0.100 | 0.132 |
0.701 0.694 | 0.706 |
0.000 0.000 | 0.000 |
| 2 spectra, DLVLLGEQFR | 0.000 | 0.103 | 0.000 | 0.000 | 0.162 | 0.000 | 0.735 | 0.000 | ||
| 1 spectrum, VLPQLQPGK | 0.000 | 0.102 | 0.000 | 0.000 | 0.000 | 0.163 | 0.735 | 0.000 | ||
| 1 spectrum, VLGSNVR | 0.000 | 0.165 | 0.092 | 0.000 | 0.000 | 0.102 | 0.641 | 0.000 | ||
| 1 spectrum, LQLTLR | 0.000 | 0.032 | 0.000 | 0.031 | 0.206 | 0.012 | 0.719 | 0.000 | ||
| 1 spectrum, IVNLLNDLYTR | 0.061 | 0.152 | 0.159 | 0.000 | 0.000 | 0.208 | 0.420 | 0.000 | ||
| 4 spectra, GLILHYYSER | 0.000 | 0.000 | 0.121 | 0.000 | 0.143 | 0.117 | 0.619 | 0.000 | ||
| 2 spectra, INVSEYTYR | 0.000 | 0.131 | 0.000 | 0.000 | 0.102 | 0.028 | 0.739 | 0.000 | ||
| 2 spectra, IIYDDSK | 0.000 | 0.059 | 0.004 | 0.000 | 0.063 | 0.136 | 0.739 | 0.000 | ||
| 4 spectra, AFPFHIIFDR | 0.000 | 0.147 | 0.000 | 0.000 | 0.023 | 0.122 | 0.709 | 0.000 | ||
| 3 spectra, YCLFGNTVNLTSR | 0.000 | 0.000 | 0.000 | 0.191 | 0.000 | 0.000 | 0.809 | 0.000 | ||
| 1 spectrum, LTQELEILTDR | 0.000 | 0.146 | 0.000 | 0.000 | 0.075 | 0.063 | 0.716 | 0.000 | ||
| 1 spectrum, GLYLSDIPLHDATR | 0.000 | 0.157 | 0.125 | 0.000 | 0.138 | 0.074 | 0.506 | 0.000 | ||
| 2 spectra, EPMQVWFLSR | 0.000 | 0.133 | 0.000 | 0.000 | 0.114 | 0.000 | 0.753 | 0.000 |
| Plot | Mito | Lyso or Perox | ER | Golgi | PM | Cytosol | Nucleus | ||||||
| Expt B |
2 peptides |
3 spectra |
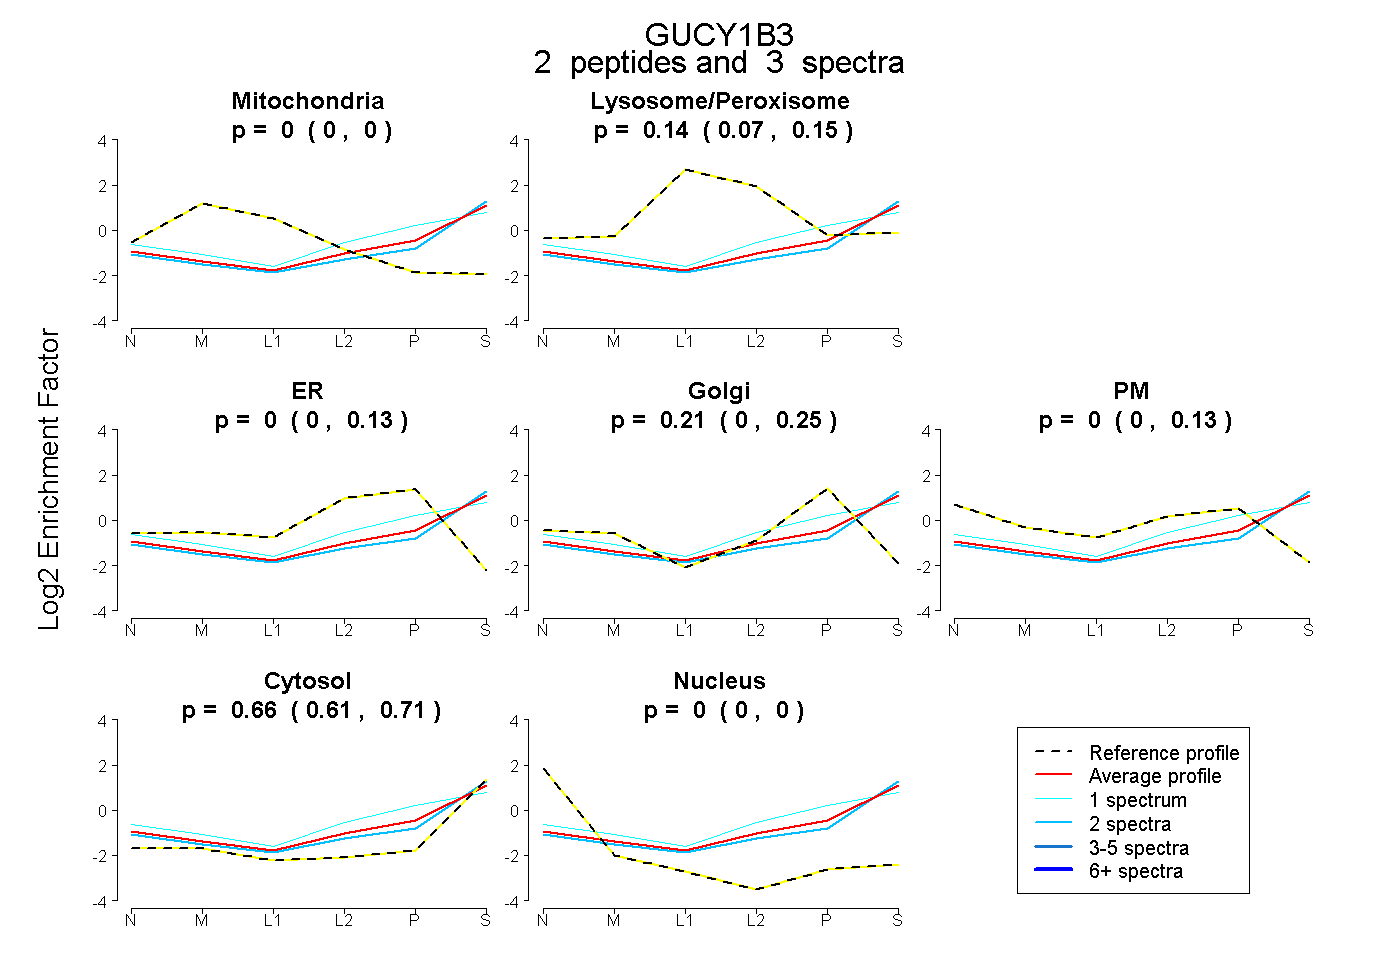 |
0.000 0.000 | 0.000 |
0.136 0.069 | 0.149 |
0.000 0.000 | 0.133 |
0.206 0.000 | 0.254 |
0.000 0.000 | 0.131 |
0.657 0.606 | 0.715 |
0.000 0.000 | 0.000 |
|||
| Plot | Lyso | Other | |||||||||||
| Expt C |
11 peptides |
31 spectra |
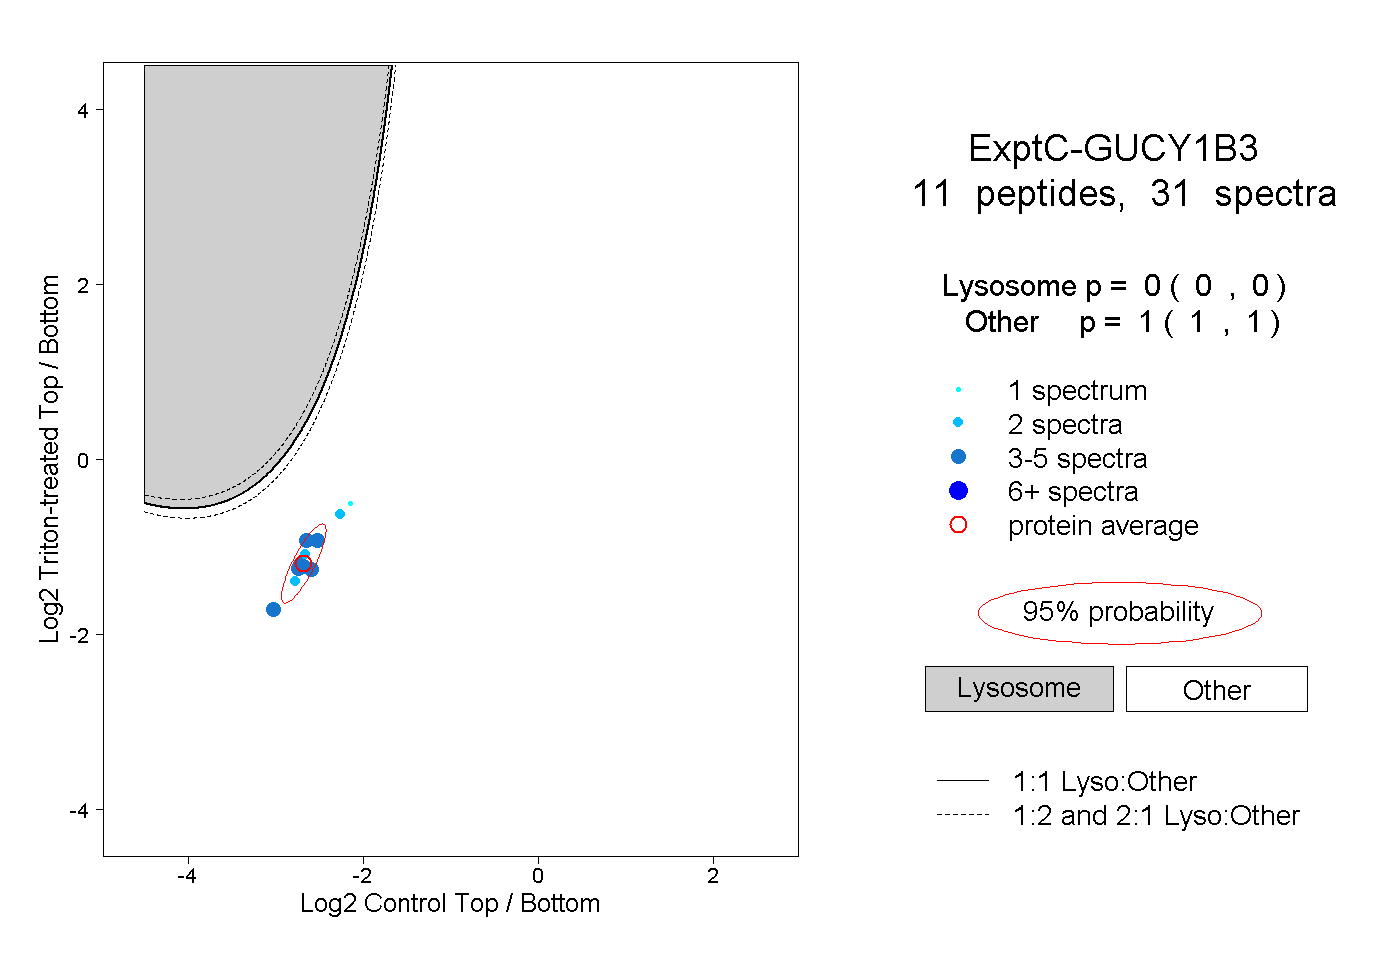 |
0.000 0.000 | 0.000 |
1.000 1.000 | 1.000 |
||||||||
| Plot | Lyso | Other | |||||||||||
| Expt D |
1 peptide |
4 spectra |
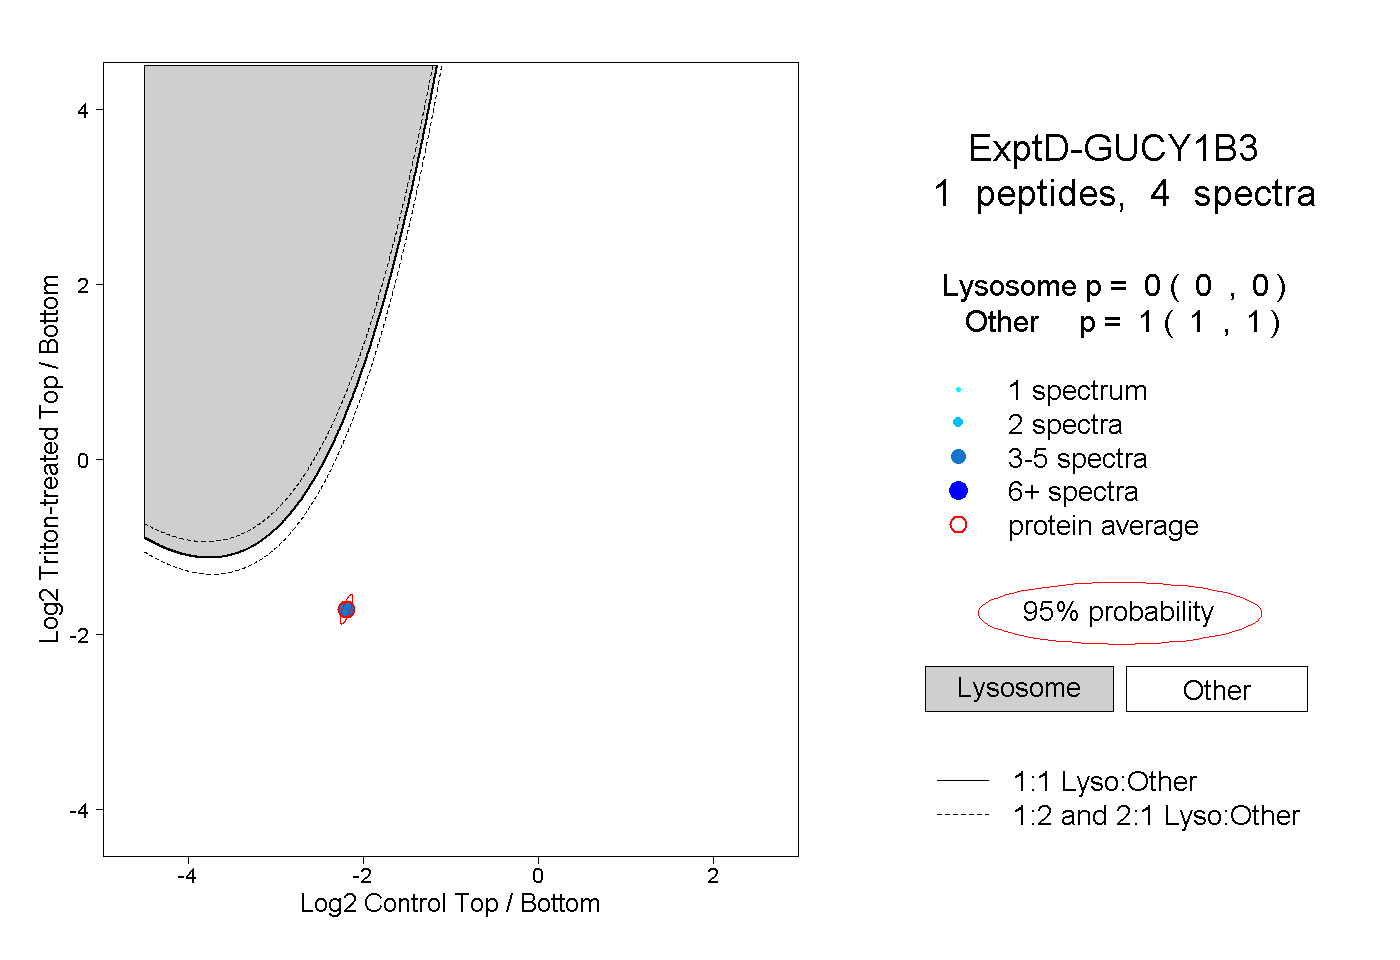 |
0.000 0.000 | 0.000 |
1.000 1.000 | 1.000 |