 3
3peptides
spectra
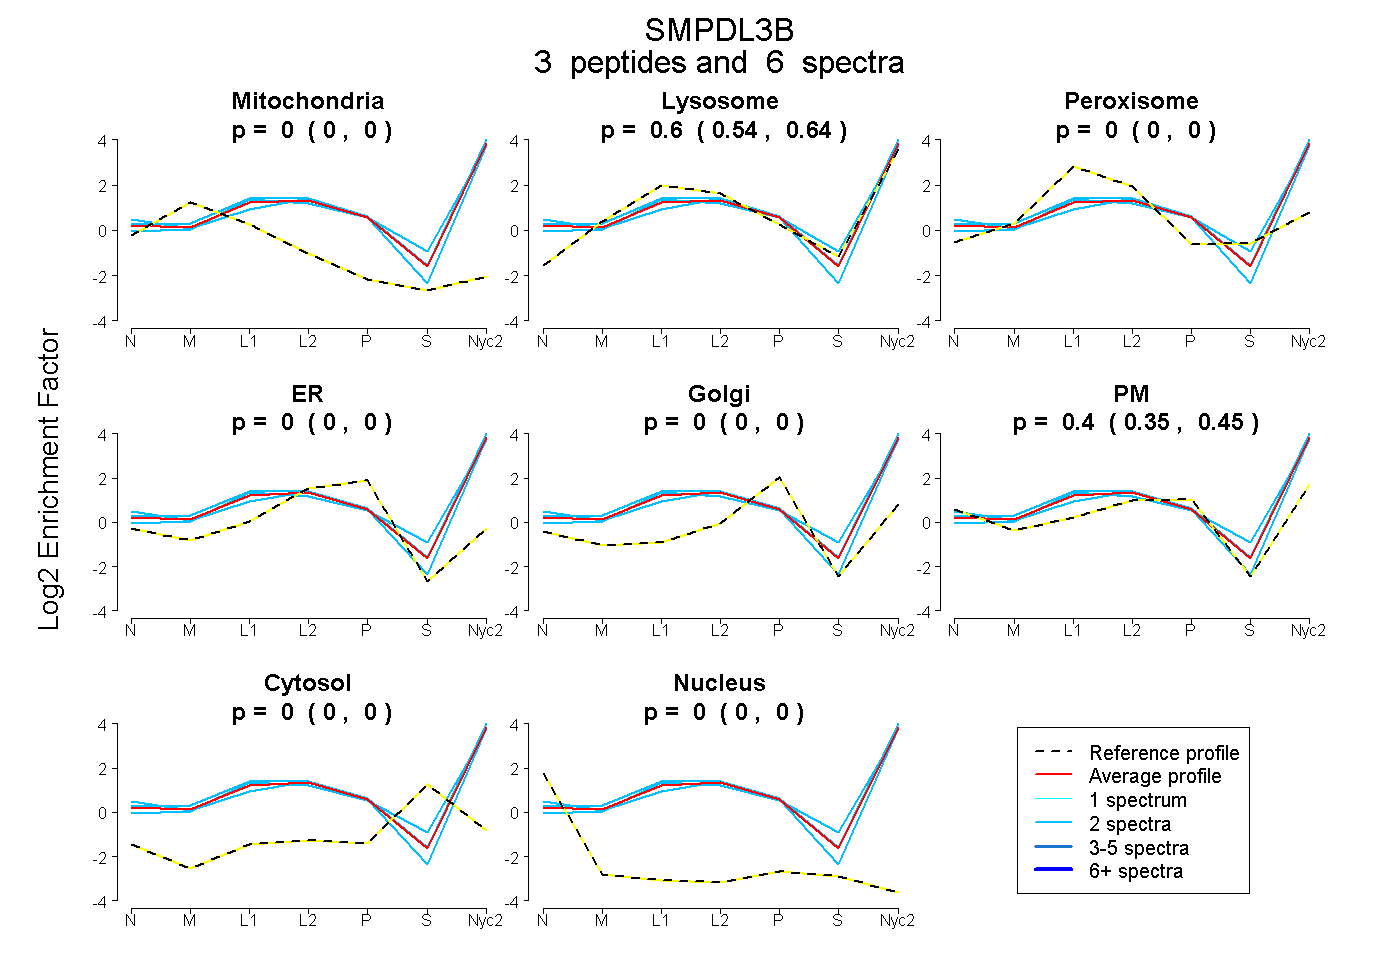
0.000 | 0.000
0.544 | 0.637
0.000 | 0.000
0.000 | 0.000
0.000 | 0.000
0.354 | 0.448
0.000 | 0.000
0.000 | 0.000
8peptides
spectra
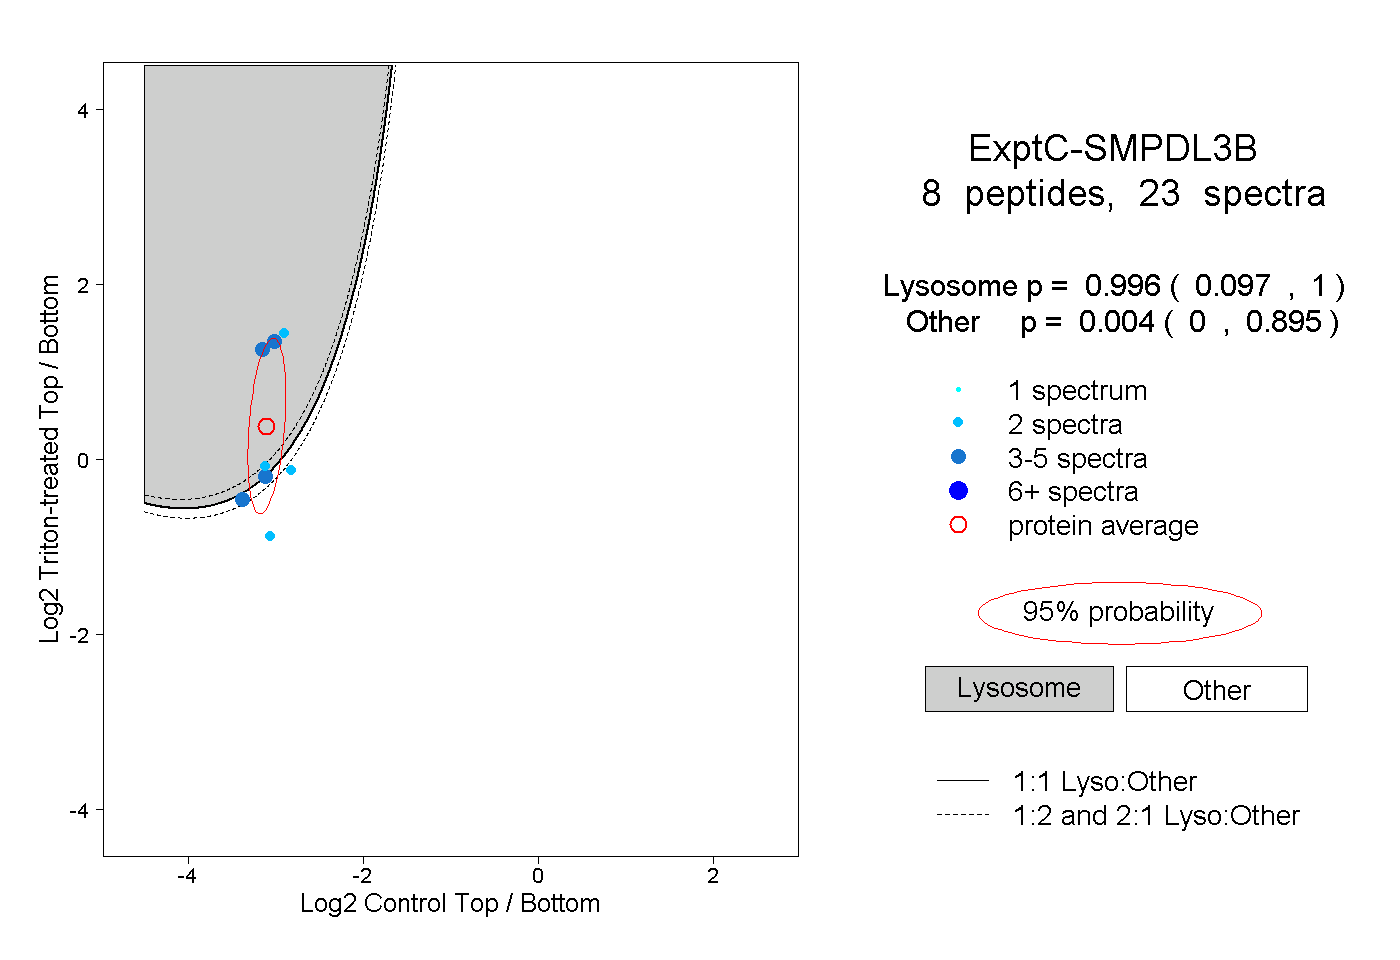
0.097 | 1.000
0.000 | 0.895
2peptides
spectra
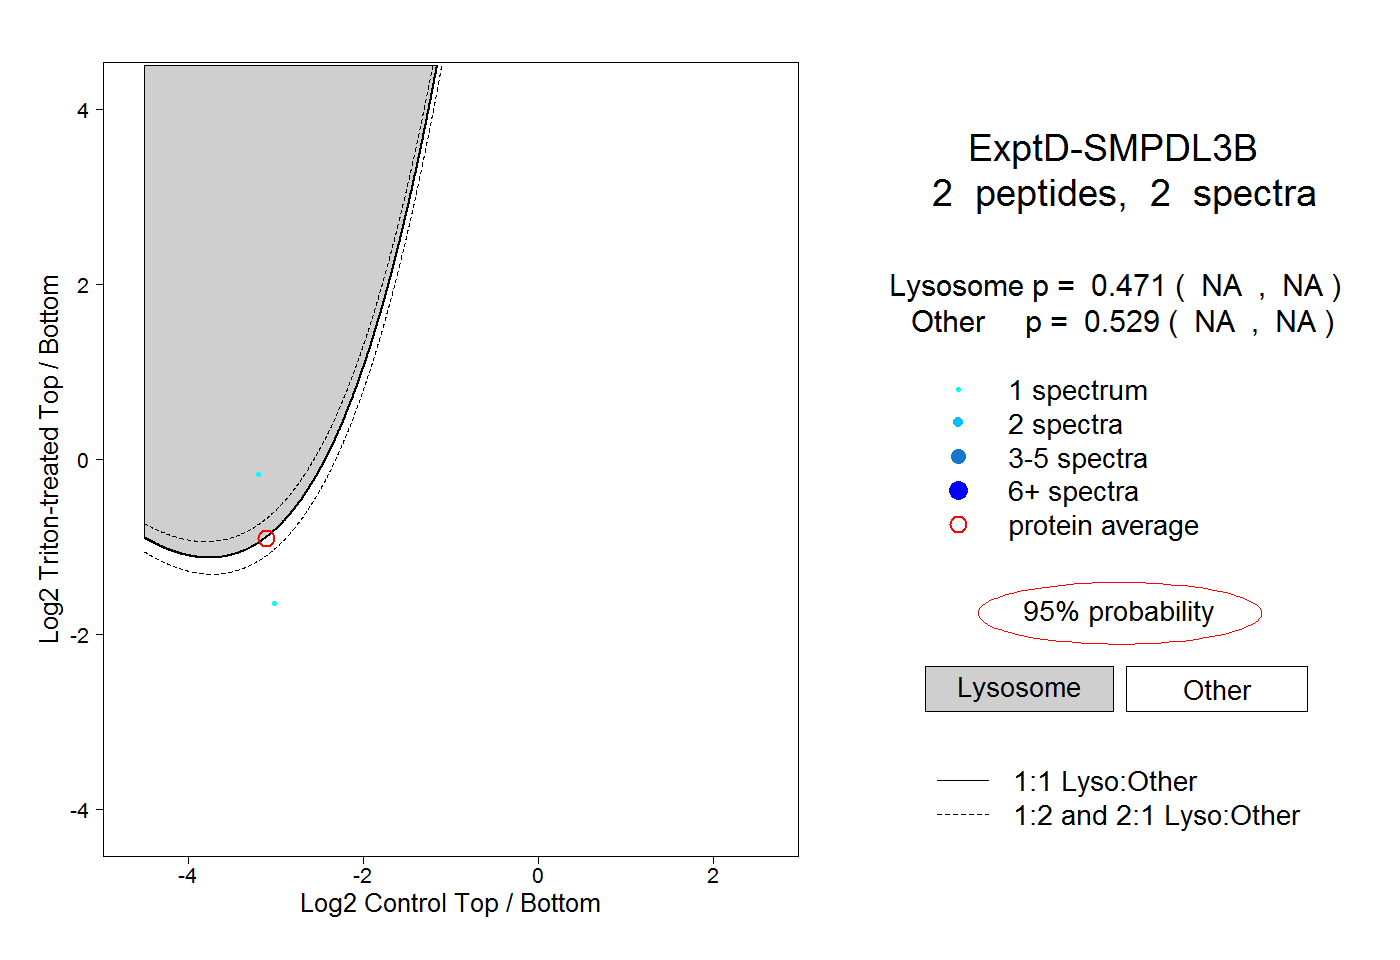
NA | NA
NA | NA