 3
3peptides
spectra
0.000 | 0.000
0.544 | 0.637
0.000 | 0.000
0.000 | 0.000
0.000 | 0.000
0.354 | 0.448
0.000 | 0.000
0.000 | 0.000
8peptides
spectra
0.097 | 1.000
0.000 | 0.895
| Plot | Mito | Lyso | Perox | ER | Golgi | PM | Cytosol | Nucleus | |||||
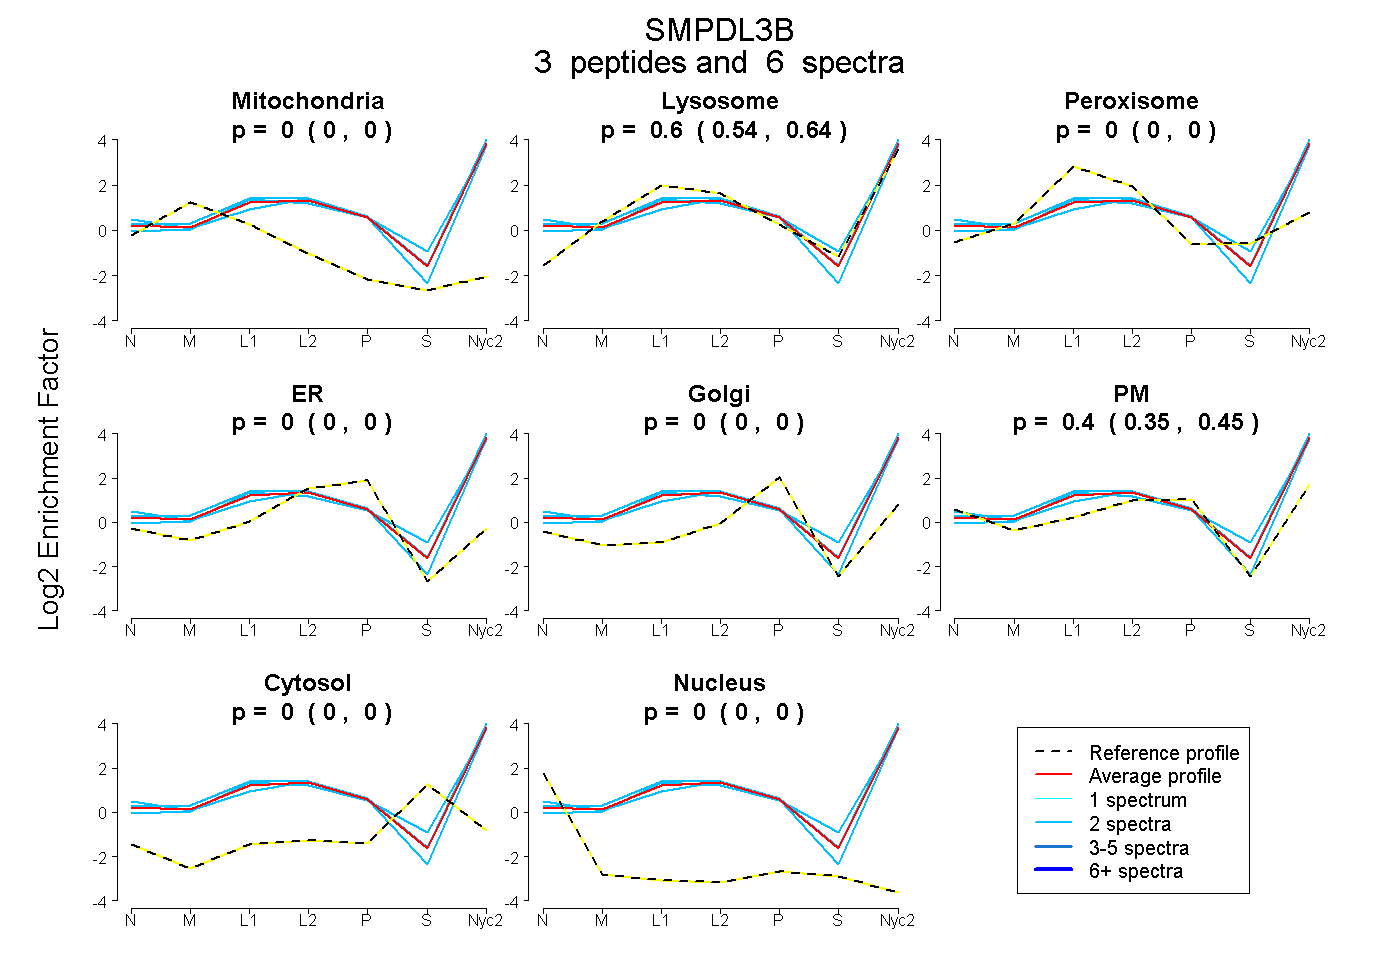
| Expt A |
3 peptides |
6 spectra |
|
0.000 0.000 | 0.000 |
0.595 0.544 | 0.637 |
0.000 0.000 | 0.000 |
0.000 0.000 | 0.000 |
0.000 0.000 | 0.000 |
0.405 0.354 | 0.448 |
0.000 0.000 | 0.000 |
0.000 0.000 | 0.000 |
||
| Plot | Lyso | Other | |||||||||||
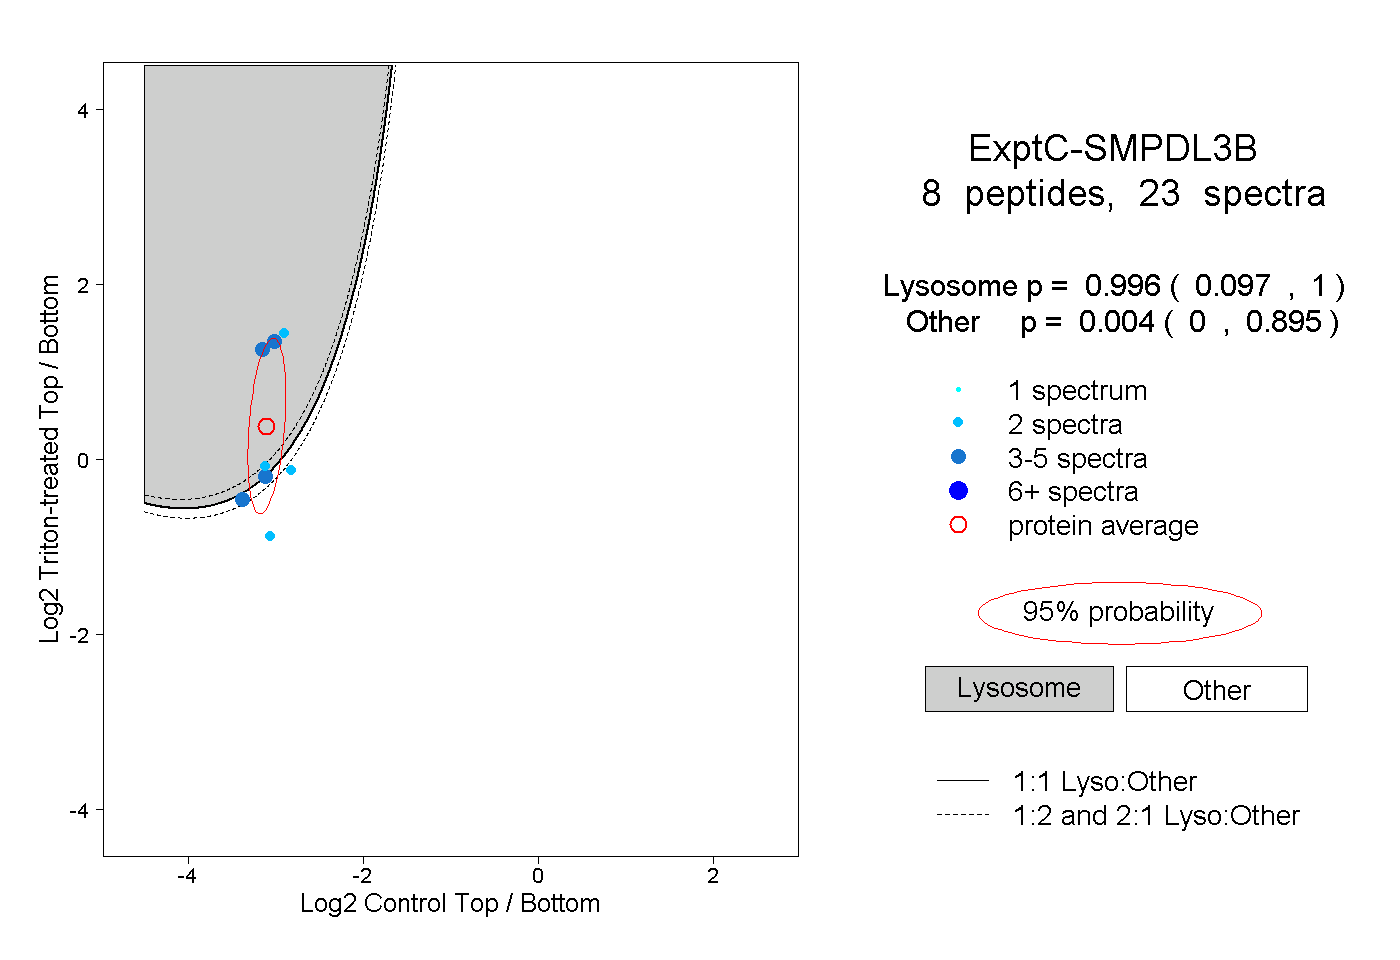
| Expt C |
8 peptides |
23 spectra |
|
0.996 0.097 | 1.000 |
0.004 0.000 | 0.895 |
| 4 spectra, EIEPKPDFIFWTGDDTPHVPNER | 1.000 | 0.000 | ||||||||
| 2 spectra, ATLNLK | 0.001 | 0.999 | ||||||||
| 2 spectra, VYAALGNHDFHPK | 0.077 | 0.923 | ||||||||
| 3 spectra, EGAFYSEK | 0.516 | 0.484 | ||||||||
| 2 spectra, IFEYDR | 1.000 | 0.000 | ||||||||
| 2 spectra, TTLPGVVDGANNPAIR | 0.733 | 0.267 | ||||||||
| 4 spectra, ESFNEEYLK | 1.000 | 0.000 | ||||||||
| 4 spectra, LGEGAVLSMVDR | 0.337 | 0.663 |
| Plot | Lyso | Other | |||||||||||
| Expt D |
2 peptides |
2 spectra |
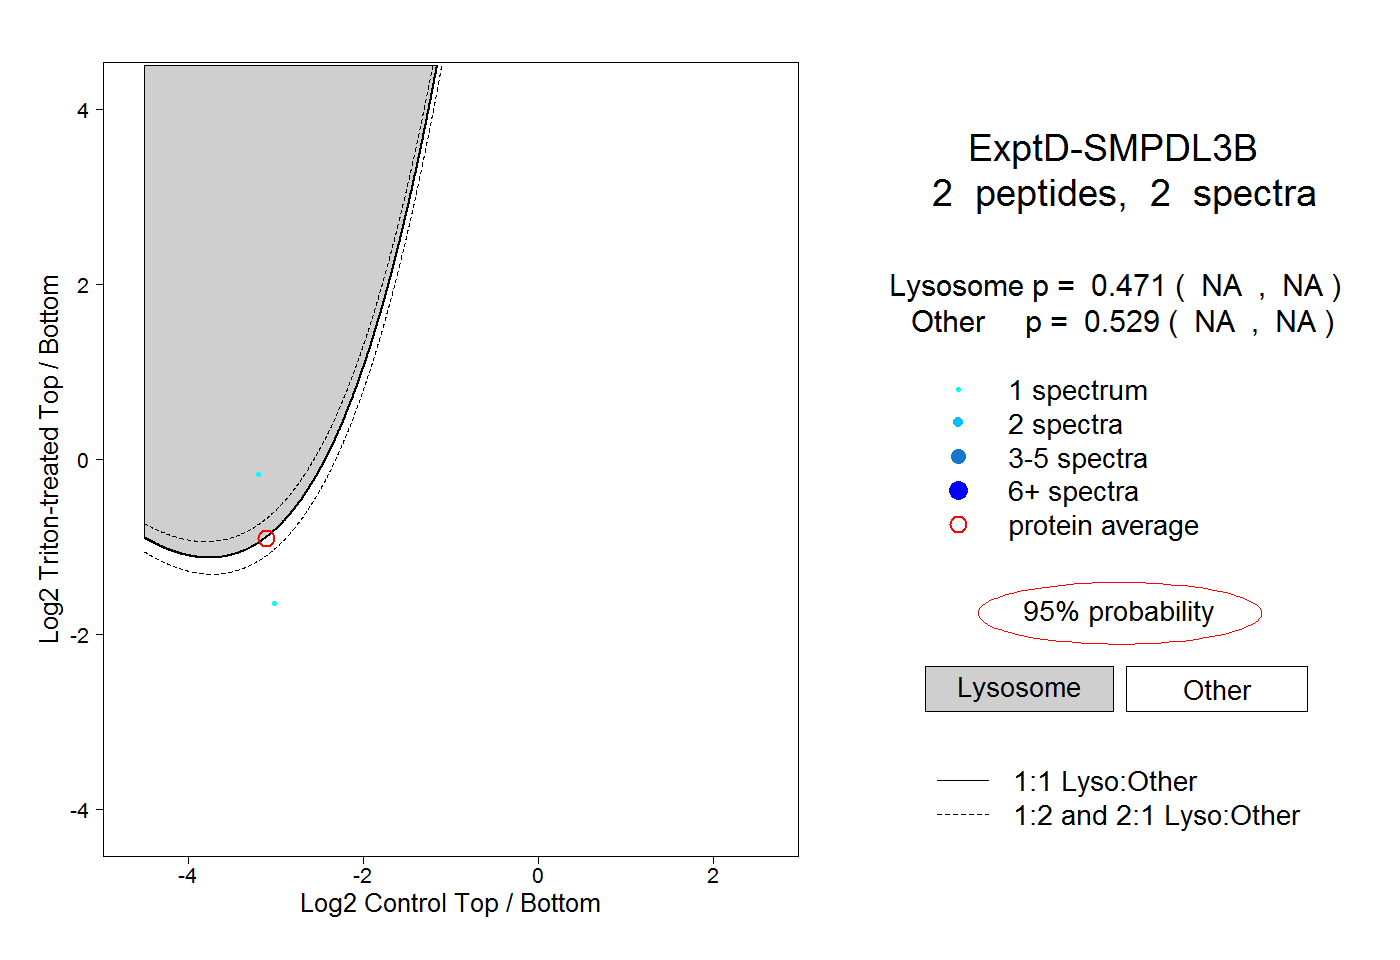 |
0.471 NA | NA |
0.529 NA | NA |