 14
14peptides
spectra
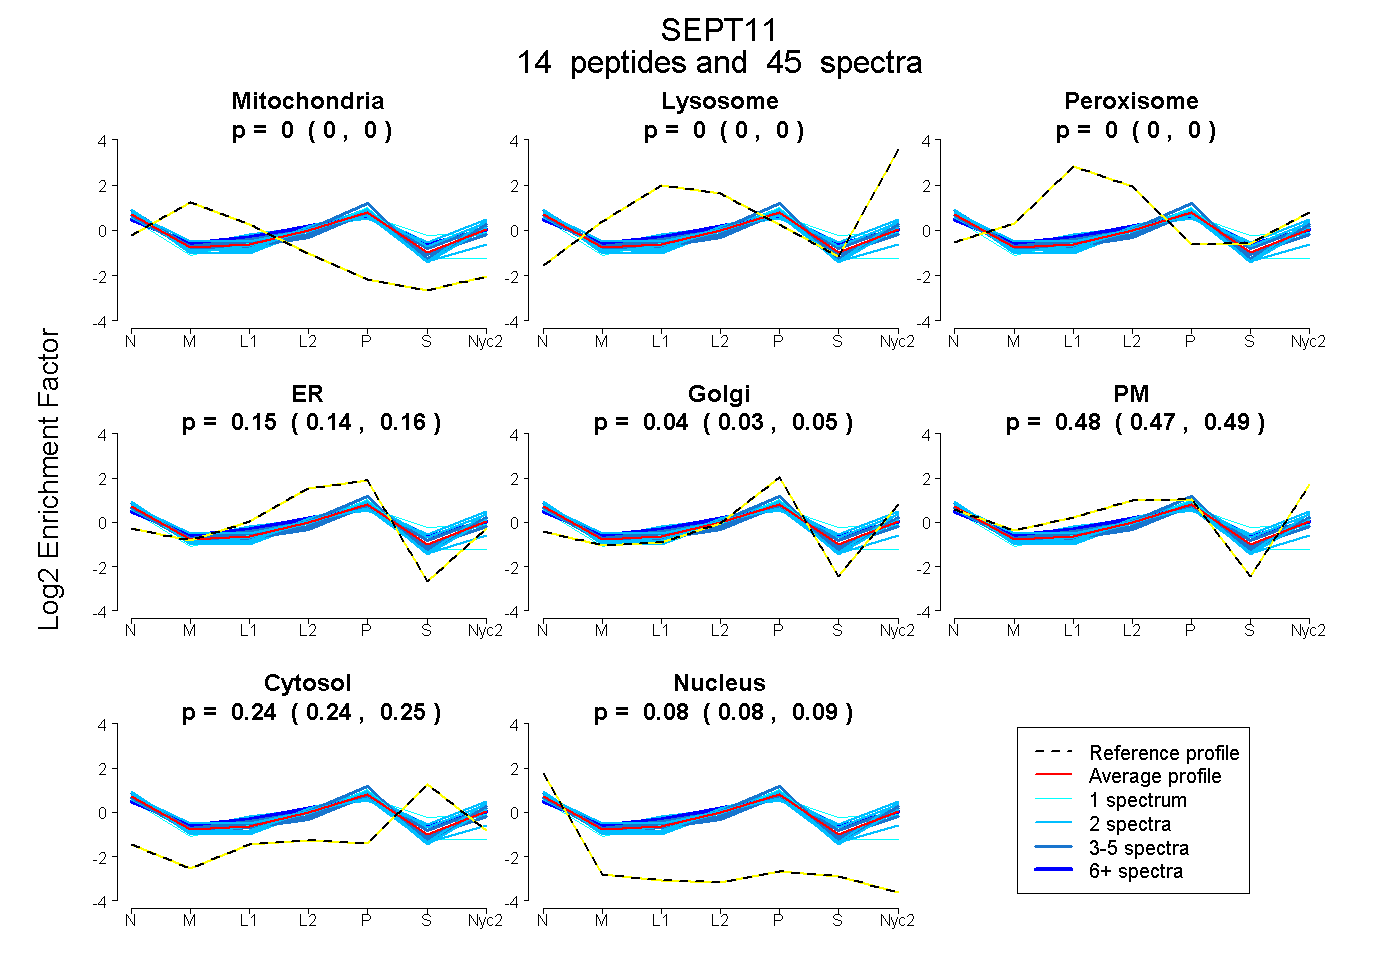
0.000 | 0.000
0.000 | 0.000
0.000 | 0.000
0.141 | 0.163
0.029 | 0.047
0.471 | 0.490
0.237 | 0.247
0.081 | 0.087
3peptides
spectra
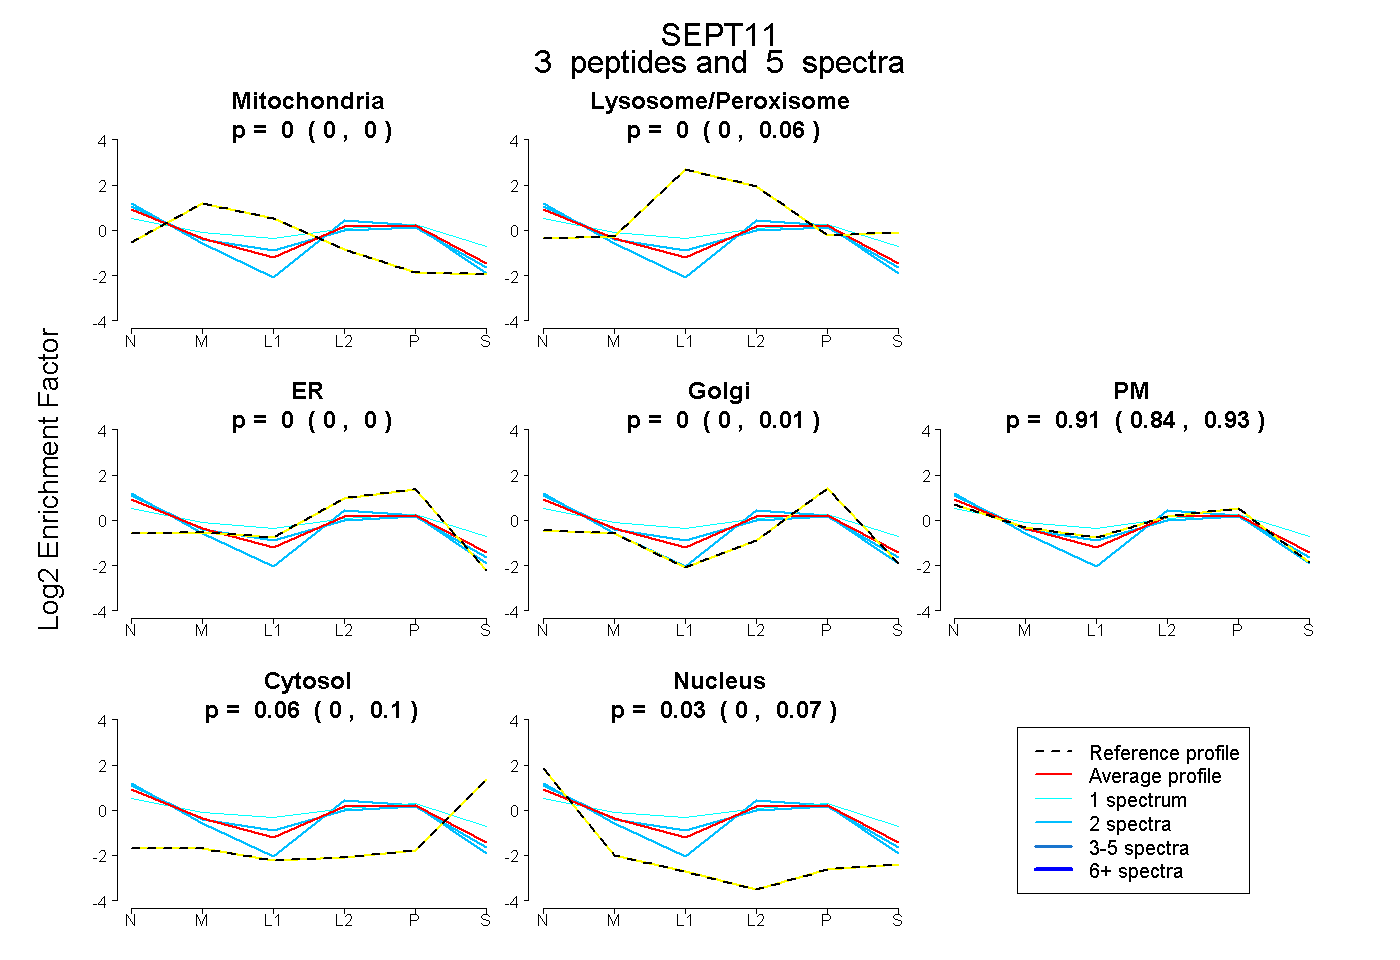
0.000 | 0.000
0.000 | 0.055
0.000 | 0.000
0.000 | 0.008
0.838 | 0.931
0.000 | 0.098
0.001 | 0.067
13peptides
spectra
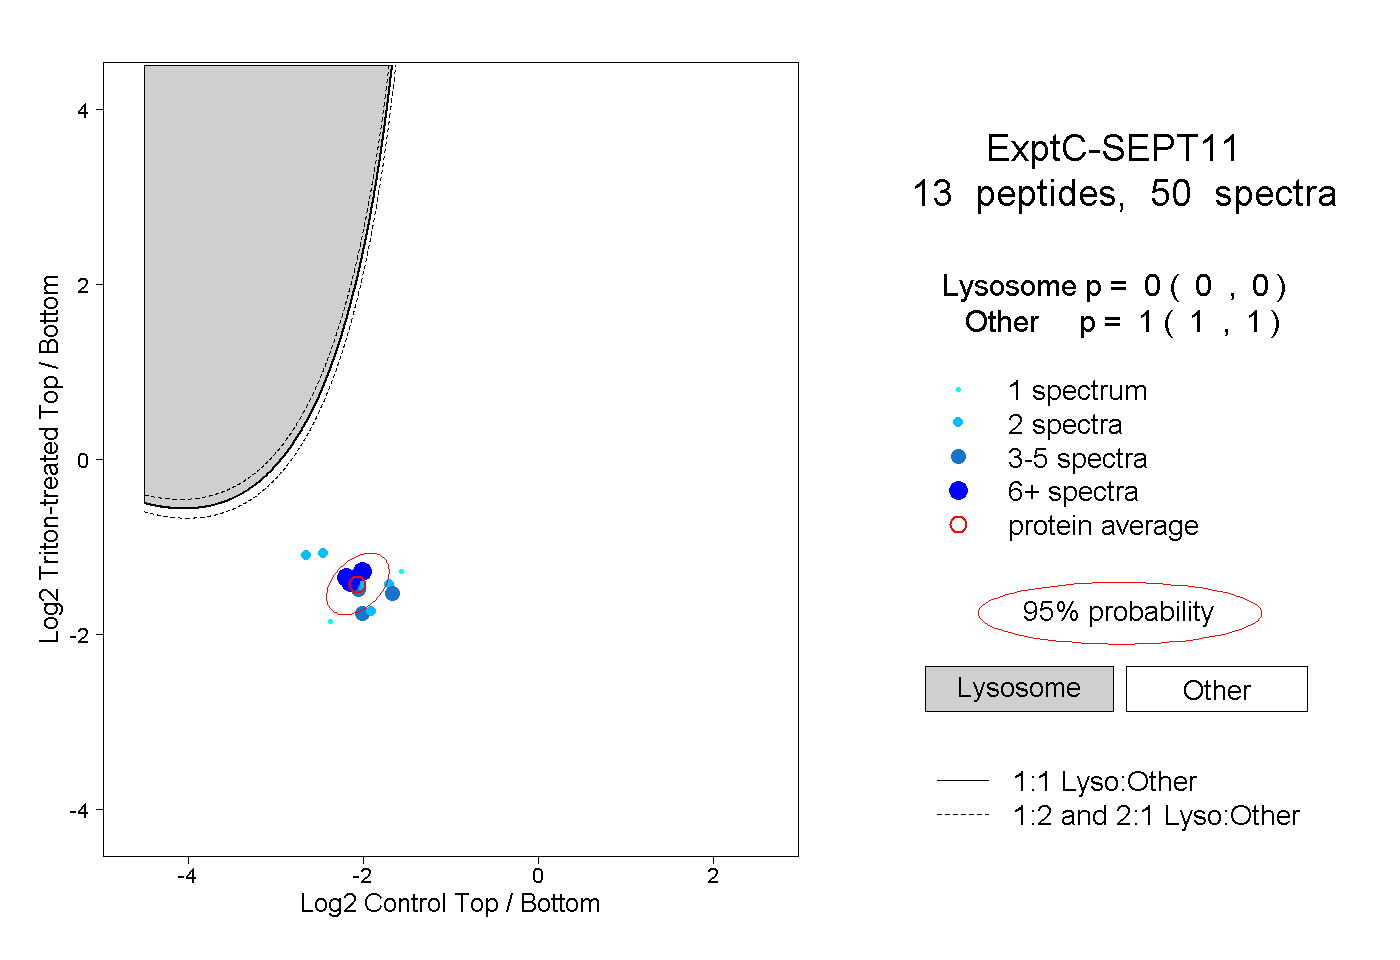
0.000 | 0.000
1.000 | 1.000
6peptides
spectra
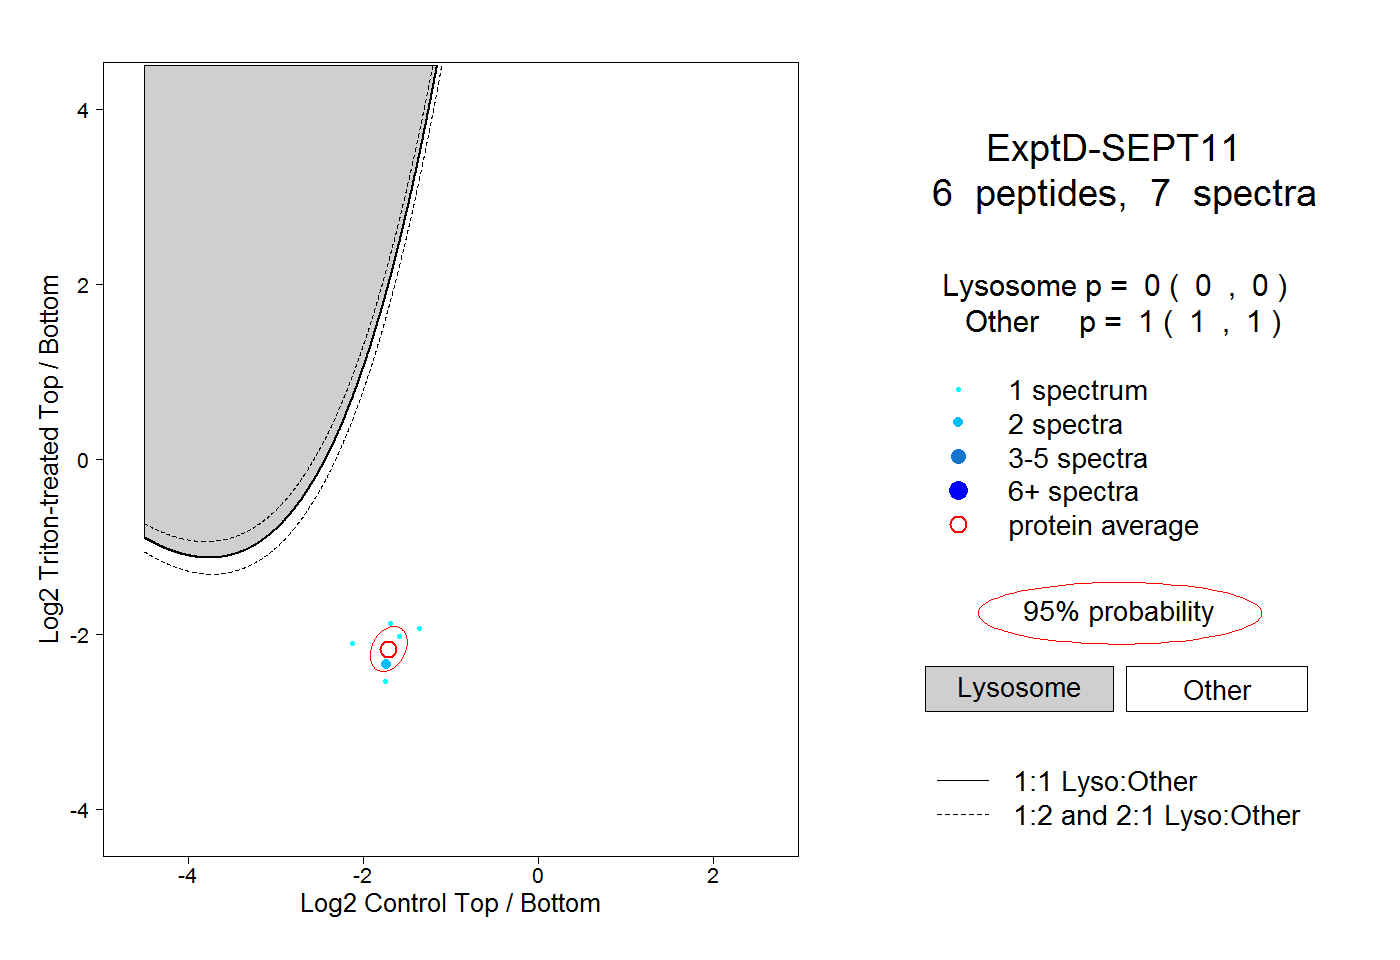
0.000 | 0.000
1.000 | 1.000