 14
14peptides
spectra
0.000 | 0.000
0.000 | 0.000
0.000 | 0.000
0.141 | 0.163
0.029 | 0.047
0.471 | 0.490
0.237 | 0.247
0.081 | 0.087
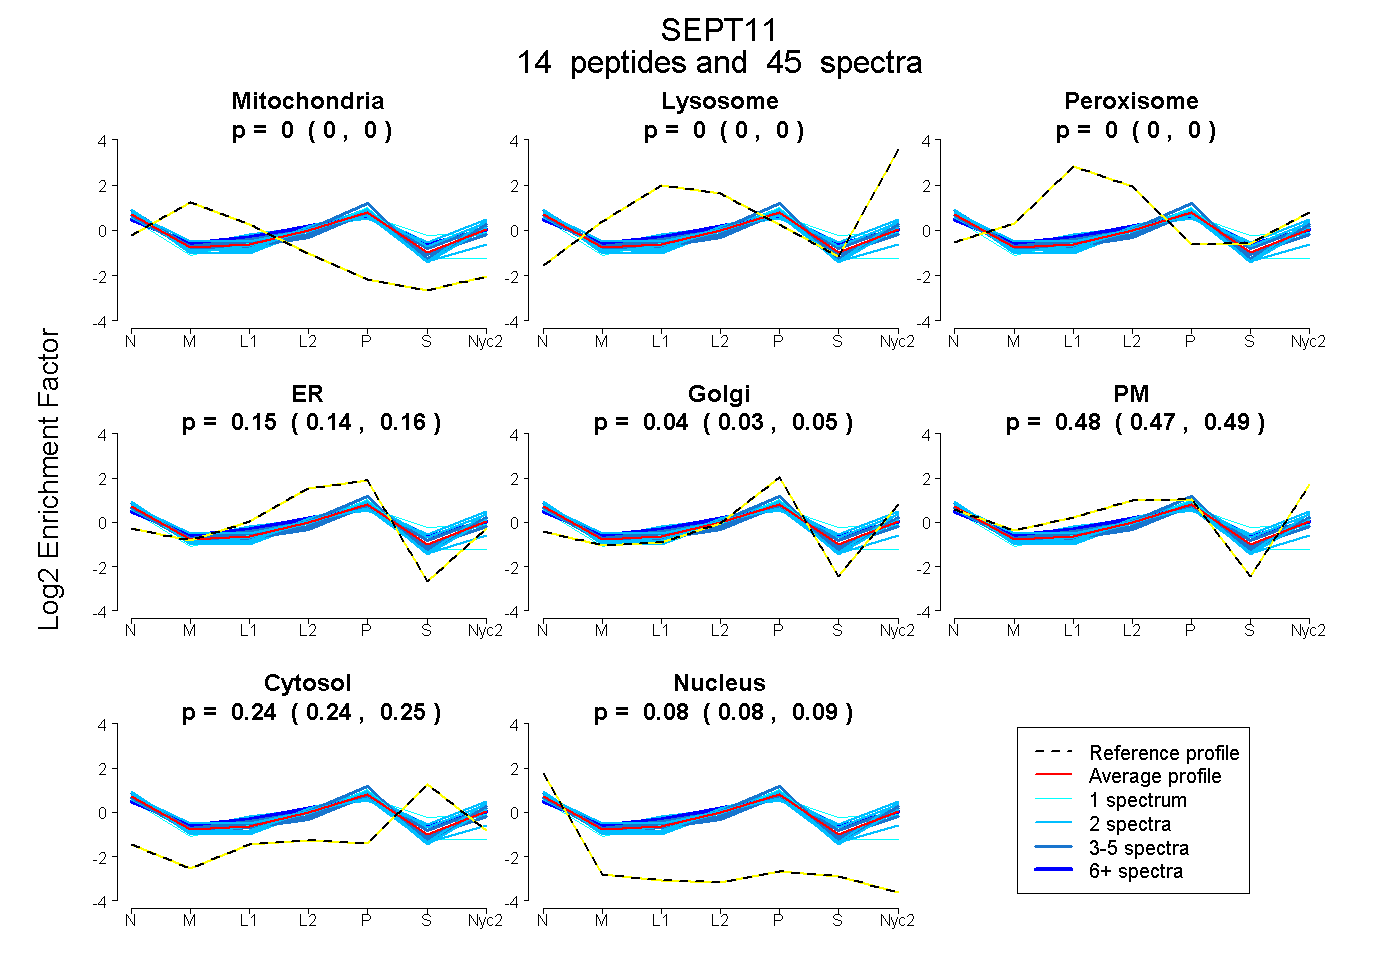
| Plot | Mito | Lyso | Perox | ER | Golgi | PM | Cytosol | Nucleus | |||||
| Expt A |
14 peptides |
45 spectra |
|
0.000 0.000 | 0.000 |
0.000 0.000 | 0.000 |
0.000 0.000 | 0.000 |
0.152 0.141 | 0.163 |
0.039 0.029 | 0.047 |
0.482 0.471 | 0.490 |
0.243 0.237 | 0.247 |
0.084 0.081 | 0.087 |
| 5 spectra, HYELYR | 0.000 | 0.000 | 0.000 | 0.000 | 0.172 | 0.477 | 0.275 | 0.076 | ||
| 4 spectra, STLMDTLFNTK | 0.000 | 0.000 | 0.069 | 0.197 | 0.081 | 0.353 | 0.191 | 0.109 | ||
| 2 spectra, THQEEK | 0.000 | 0.000 | 0.000 | 0.093 | 0.103 | 0.520 | 0.144 | 0.140 | ||
| 13 spectra, FESDPATHNEPGVR | 0.021 | 0.000 | 0.059 | 0.160 | 0.000 | 0.433 | 0.296 | 0.030 | ||
| 2 spectra, SYELQESNVR | 0.000 | 0.000 | 0.000 | 0.353 | 0.000 | 0.318 | 0.153 | 0.175 | ||
| 4 spectra, QMFVMR | 0.000 | 0.000 | 0.000 | 0.123 | 0.218 | 0.430 | 0.156 | 0.073 | ||
| 2 spectra, LEEMGFK | 0.000 | 0.000 | 0.000 | 0.045 | 0.143 | 0.490 | 0.296 | 0.026 | ||
| 1 spectrum, QYPWGVVQVENENHCDFVK | 0.000 | 0.000 | 0.068 | 0.496 | 0.094 | 0.000 | 0.140 | 0.201 | ||
| 2 spectra, NEFLGELQK | 0.000 | 0.000 | 0.000 | 0.000 | 0.000 | 0.623 | 0.340 | 0.037 | ||
| 2 spectra, FDLLK | 0.000 | 0.000 | 0.000 | 0.043 | 0.263 | 0.429 | 0.138 | 0.127 | ||
| 3 spectra, SLDLVTMK | 0.000 | 0.000 | 0.000 | 0.010 | 0.121 | 0.563 | 0.182 | 0.124 | ||
| 2 spectra, ADTIAK | 0.000 | 0.000 | 0.101 | 0.203 | 0.000 | 0.352 | 0.292 | 0.052 | ||
| 1 spectrum, ELEEEVSNFQK | 0.000 | 0.000 | 0.000 | 0.166 | 0.000 | 0.406 | 0.408 | 0.020 | ||
| 2 spectra, VNMEDLR | 0.039 | 0.000 | 0.000 | 0.000 | 0.053 | 0.661 | 0.166 | 0.082 |
| Plot | Mito | Lyso or Perox | ER | Golgi | PM | Cytosol | Nucleus | ||||||
| Expt B |
3 peptides |
5 spectra |
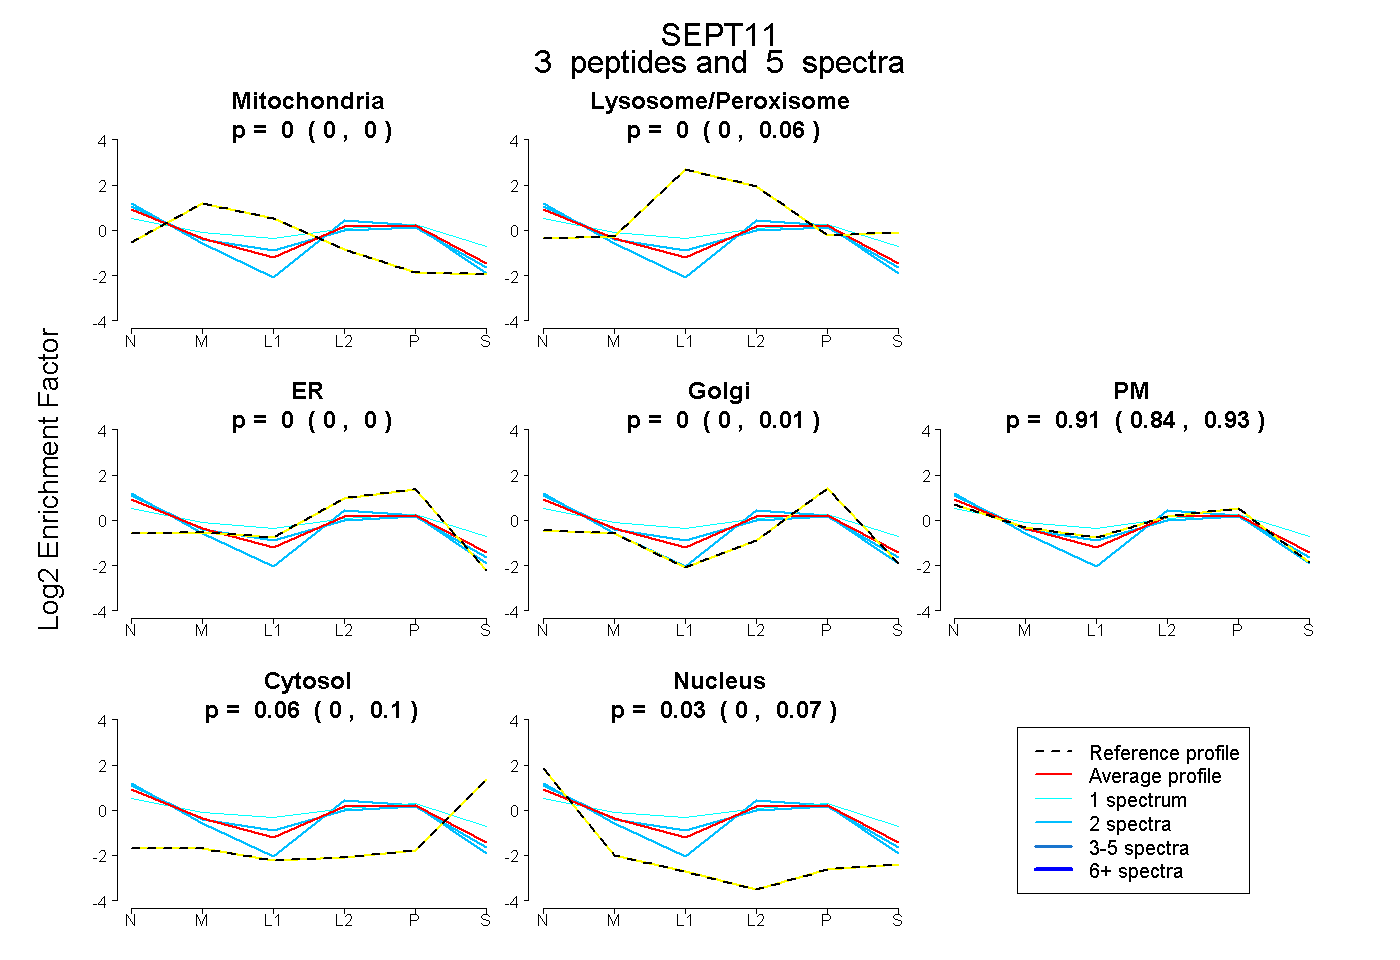 |
0.000 0.000 | 0.000 |
0.000 0.000 | 0.055 |
0.000 0.000 | 0.000 |
0.000 0.000 | 0.008 |
0.912 0.838 | 0.931 |
0.058 0.000 | 0.098 |
0.030 0.001 | 0.067 |
|||
| Plot | Lyso | Other | |||||||||||
| Expt C |
13 peptides |
50 spectra |
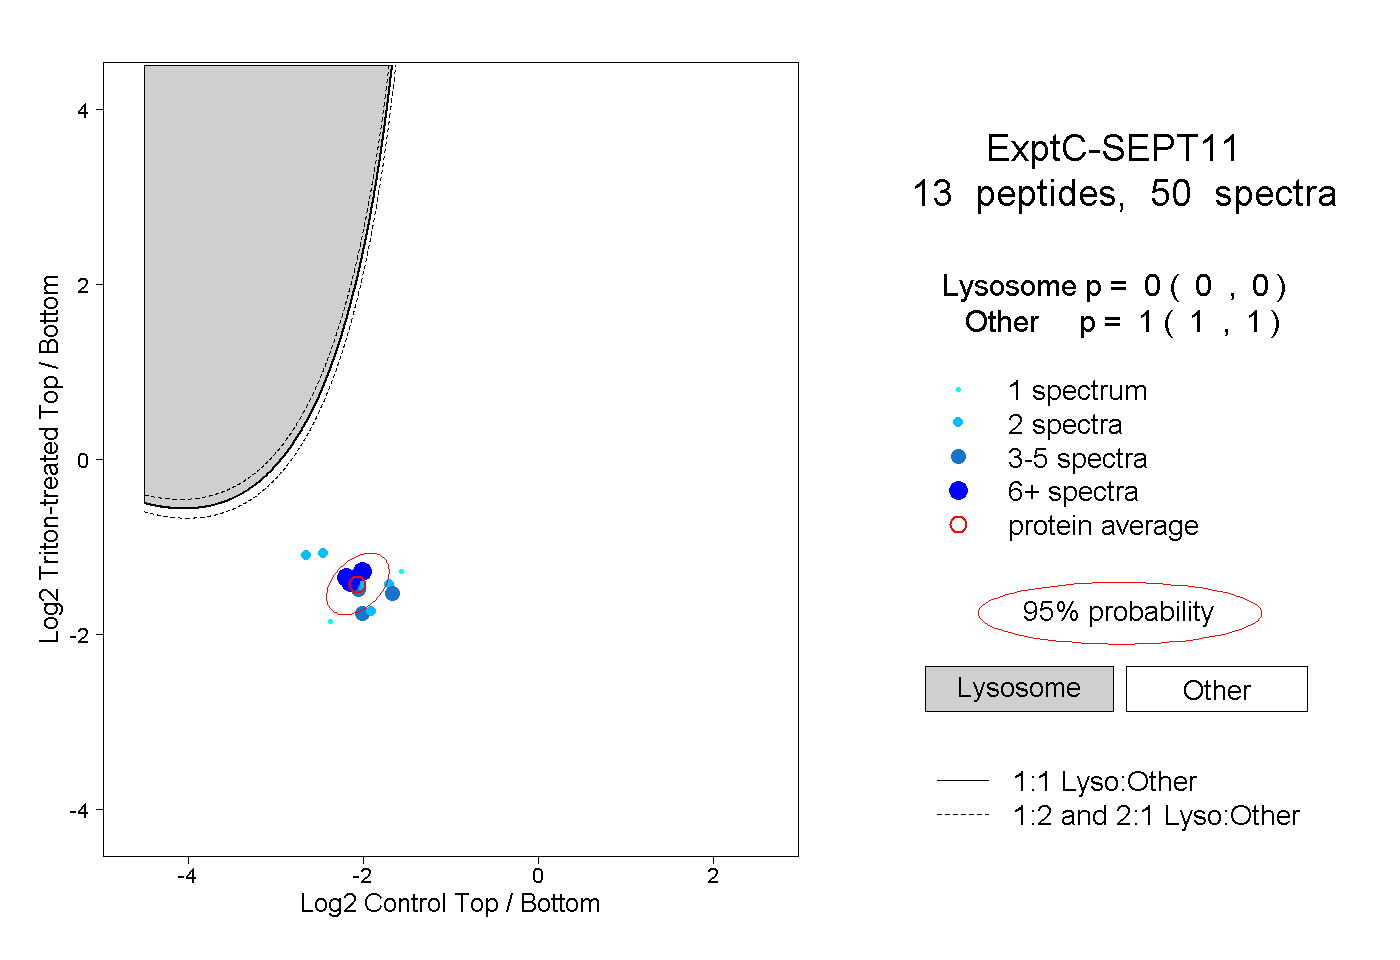 |
0.000 0.000 | 0.000 |
1.000 1.000 | 1.000 |
||||||||
| Plot | Lyso | Other | |||||||||||
| Expt D |
6 peptides |
7 spectra |
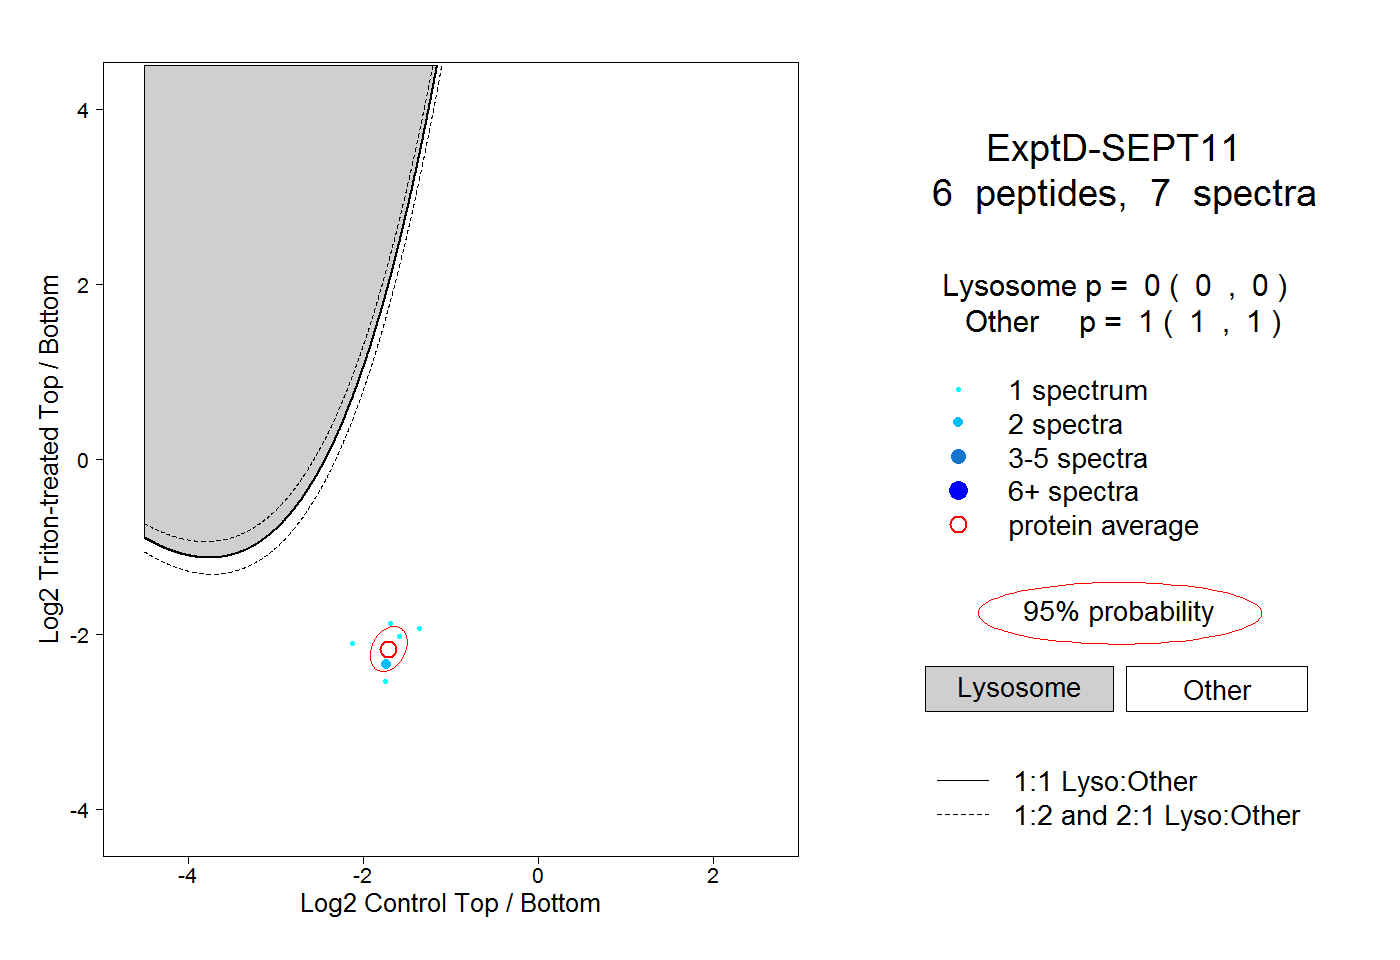 |
0.000 0.000 | 0.000 |
1.000 1.000 | 1.000 |