 5
5peptides
spectra
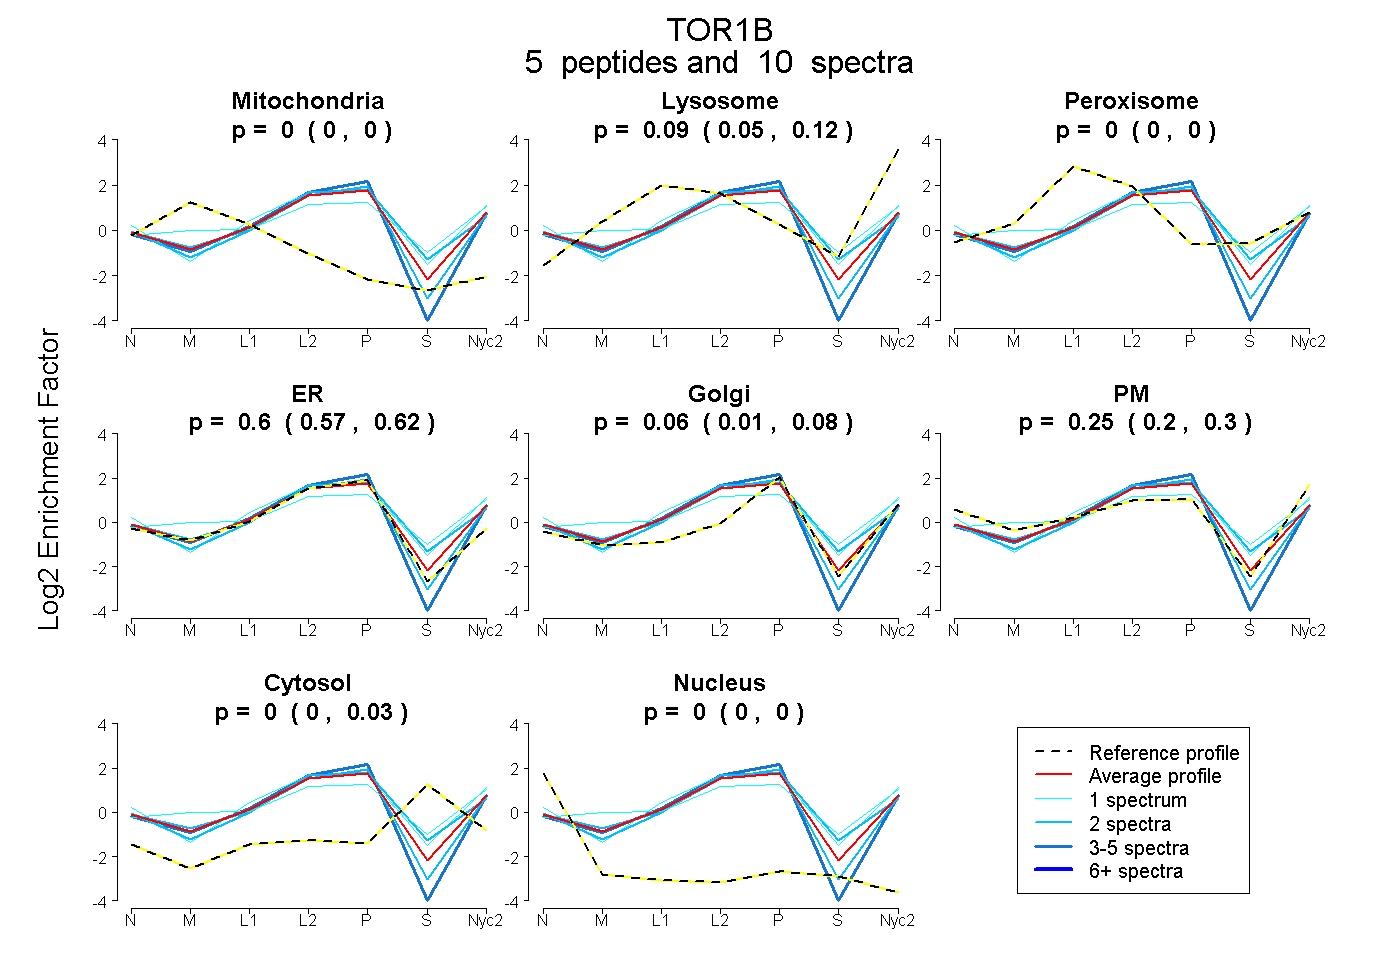
0.000 | 0.000
0.055 | 0.117
0.000 | 0.000
0.574 | 0.622
0.012 | 0.081
0.200 | 0.301
0.000 | 0.034
0.000 | 0.000
2peptides
spectra
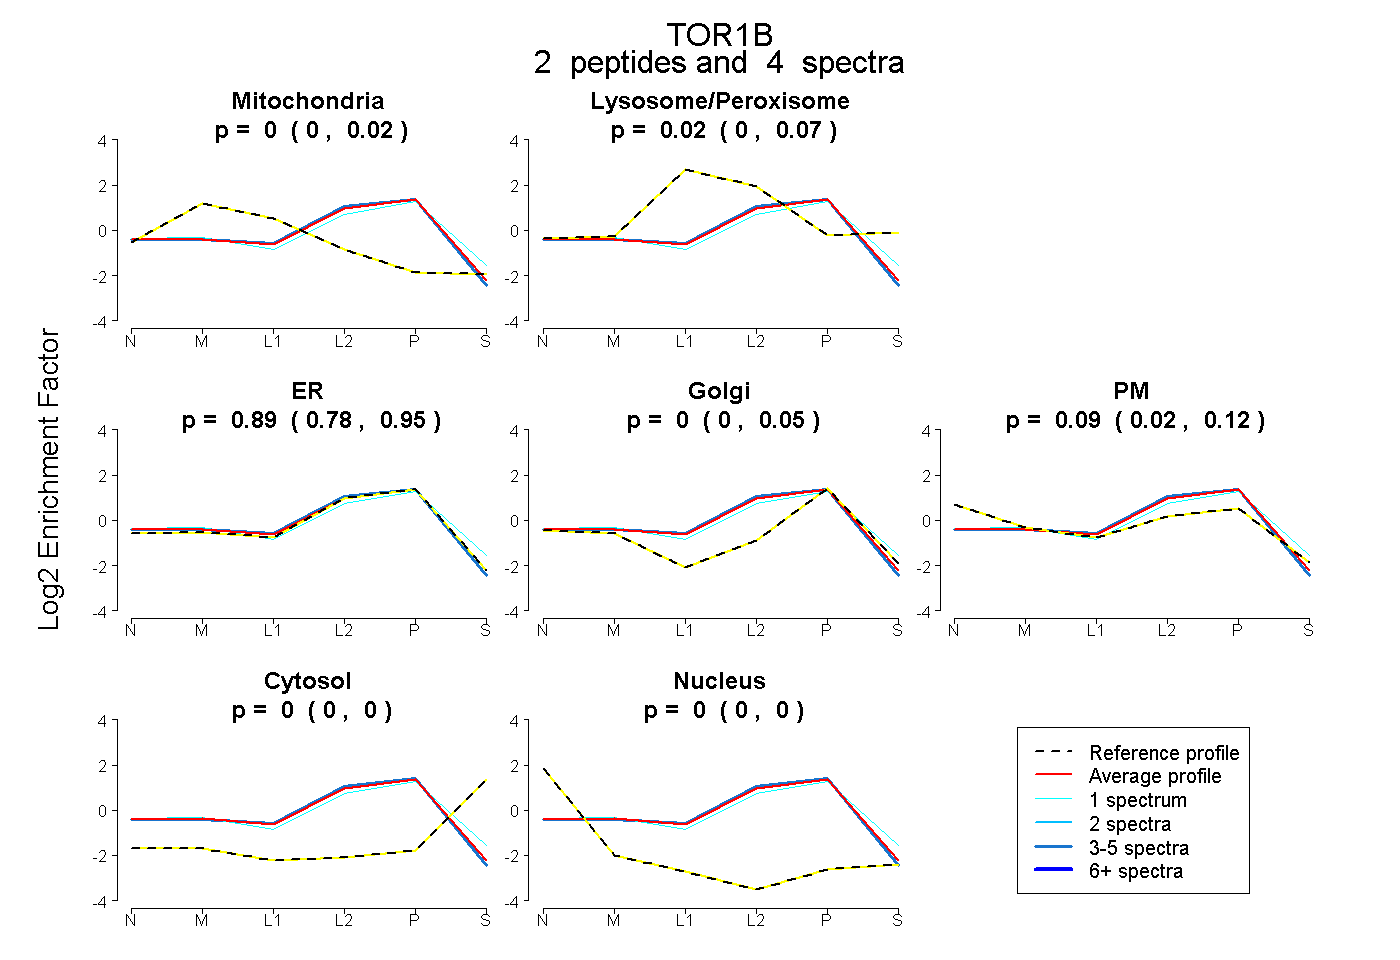
0.000 | 0.024
0.000 | 0.070
0.785 | 0.952
0.000 | 0.048
0.021 | 0.115
0.000 | 0.000
0.000 | 0.000
3peptides
spectra
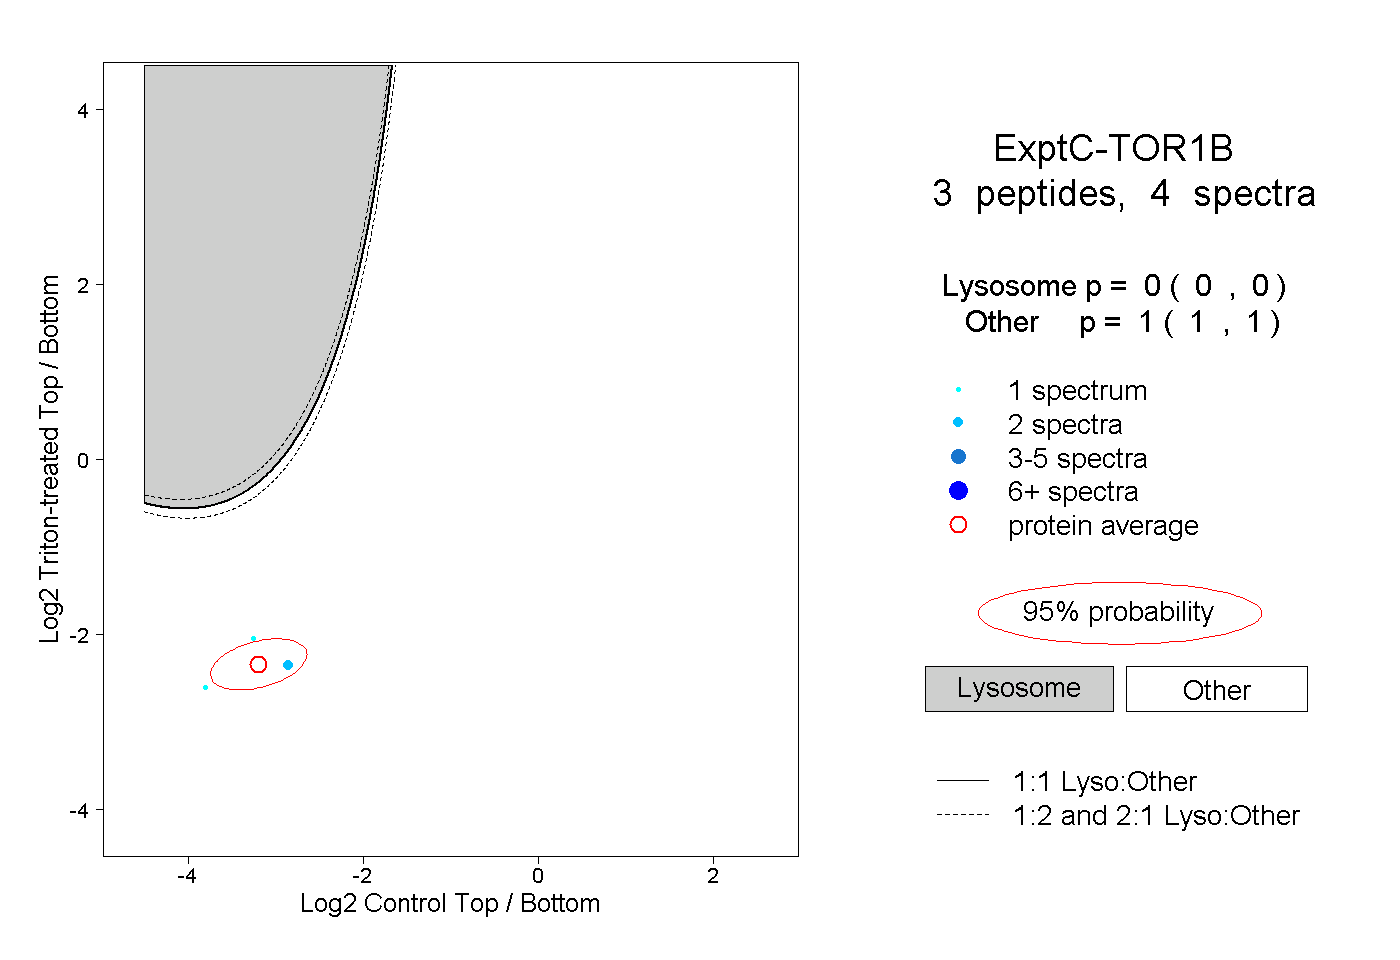
0.000 | 0.000
1.000 | 1.000