 5
5peptides
spectra
0.000 | 0.000
0.055 | 0.117
0.000 | 0.000
0.574 | 0.622
0.012 | 0.081
0.200 | 0.301
0.000 | 0.034
0.000 | 0.000
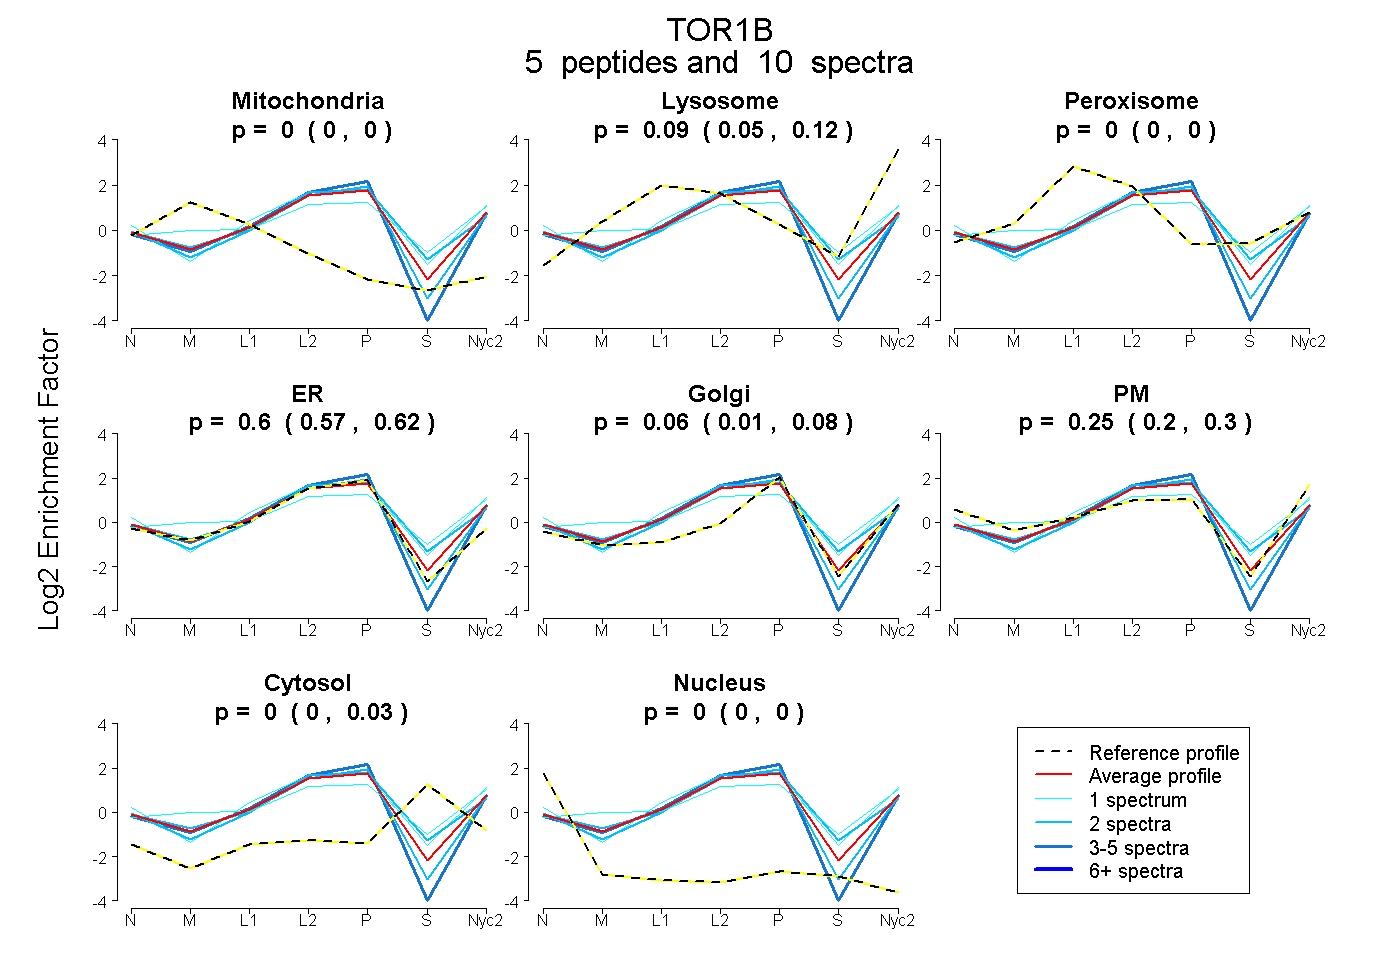
| Plot | Mito | Lyso | Perox | ER | Golgi | PM | Cytosol | Nucleus | |||||
| Expt A |
5 peptides |
10 spectra |
|
0.000 0.000 | 0.000 |
0.093 0.055 | 0.117 |
0.000 0.000 | 0.000 |
0.600 0.574 | 0.622 |
0.062 0.012 | 0.081 |
0.245 0.200 | 0.301 |
0.000 0.000 | 0.034 |
0.000 0.000 | 0.000 |
| 2 spectra, LYQDQLQK | 0.000 | 0.000 | 0.000 | 0.644 | 0.025 | 0.331 | 0.000 | 0.000 | ||
| 4 spectra, ALTGFR | 0.000 | 0.000 | 0.000 | 0.742 | 0.000 | 0.258 | 0.000 | 0.000 | ||
| 1 spectrum, TTLDFWR | 0.000 | 0.157 | 0.124 | 0.208 | 0.171 | 0.241 | 0.098 | 0.000 | ||
| 1 spectrum, DLEPVLSVGVFNNK | 0.000 | 0.119 | 0.009 | 0.467 | 0.000 | 0.350 | 0.055 | 0.000 | ||
| 2 spectra, LFGQHLATEVILK | 0.000 | 0.112 | 0.000 | 0.642 | 0.000 | 0.137 | 0.108 | 0.000 |
| Plot | Mito | Lyso or Perox | ER | Golgi | PM | Cytosol | Nucleus | ||||||
| Expt B |
2 peptides |
4 spectra |
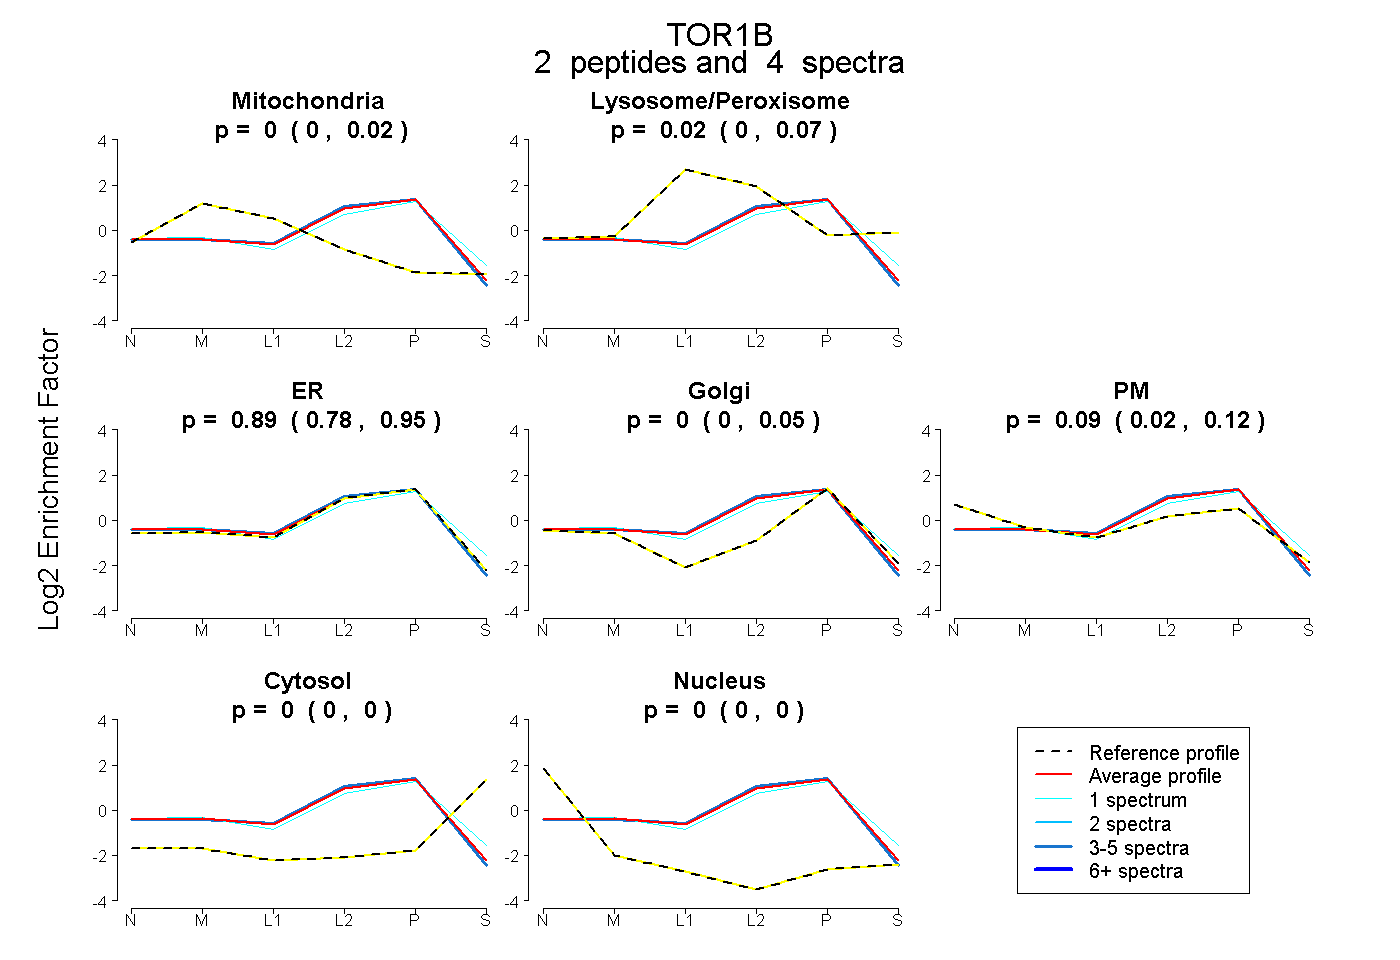 |
0.000 0.000 | 0.024 |
0.019 0.000 | 0.070 |
0.893 0.785 | 0.952 |
0.000 0.000 | 0.048 |
0.087 0.021 | 0.115 |
0.000 0.000 | 0.000 |
0.000 0.000 | 0.000 |
|||
| Plot | Lyso | Other | |||||||||||
| Expt C |
3 peptides |
4 spectra |
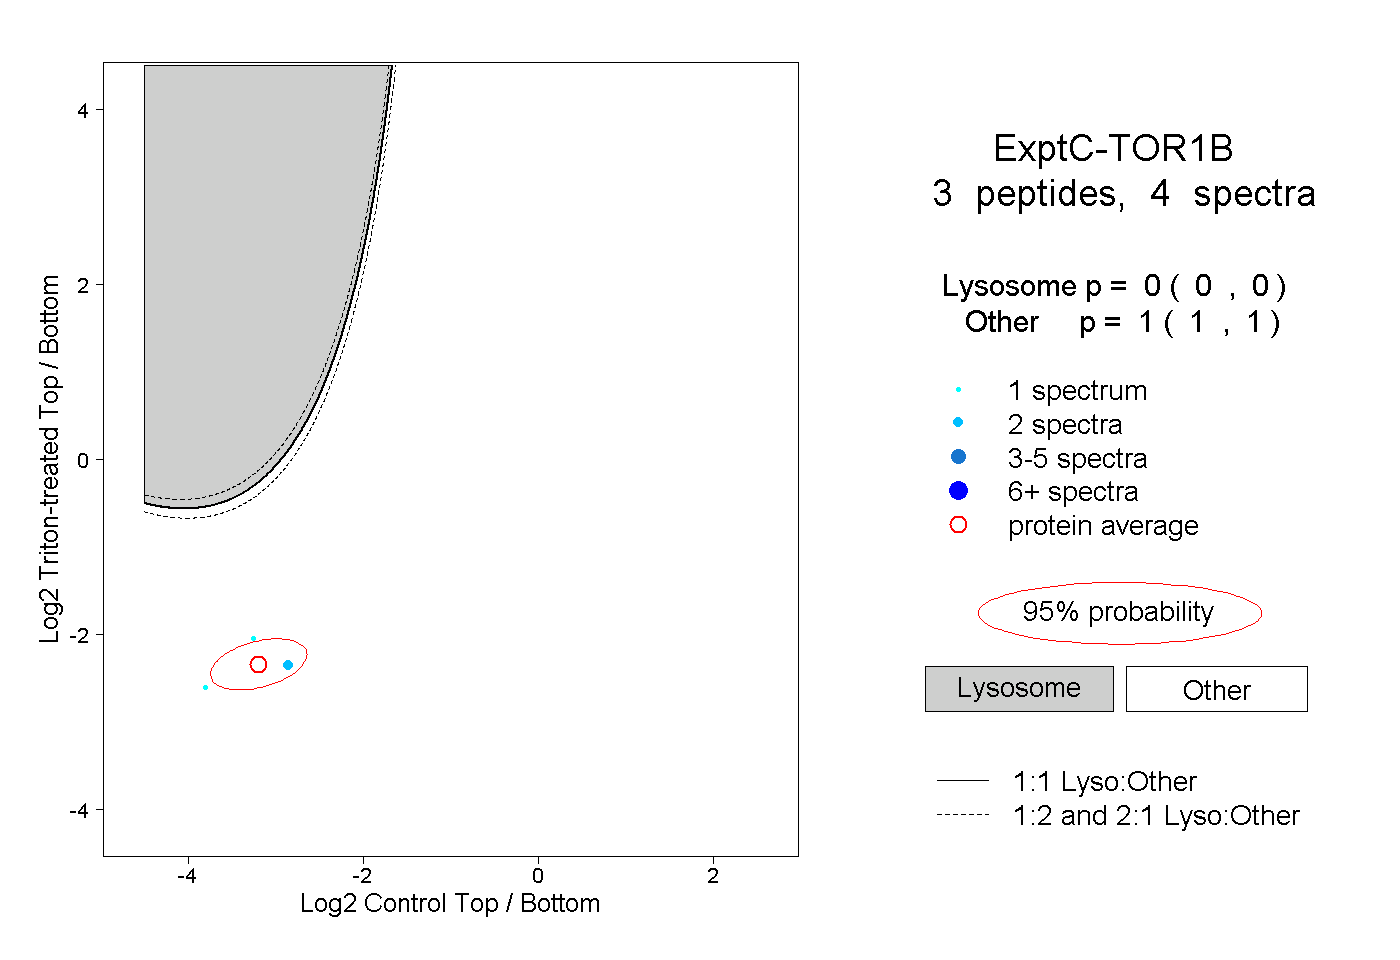 |
0.000 0.000 | 0.000 |
1.000 1.000 | 1.000 |