 7
7peptides
spectra
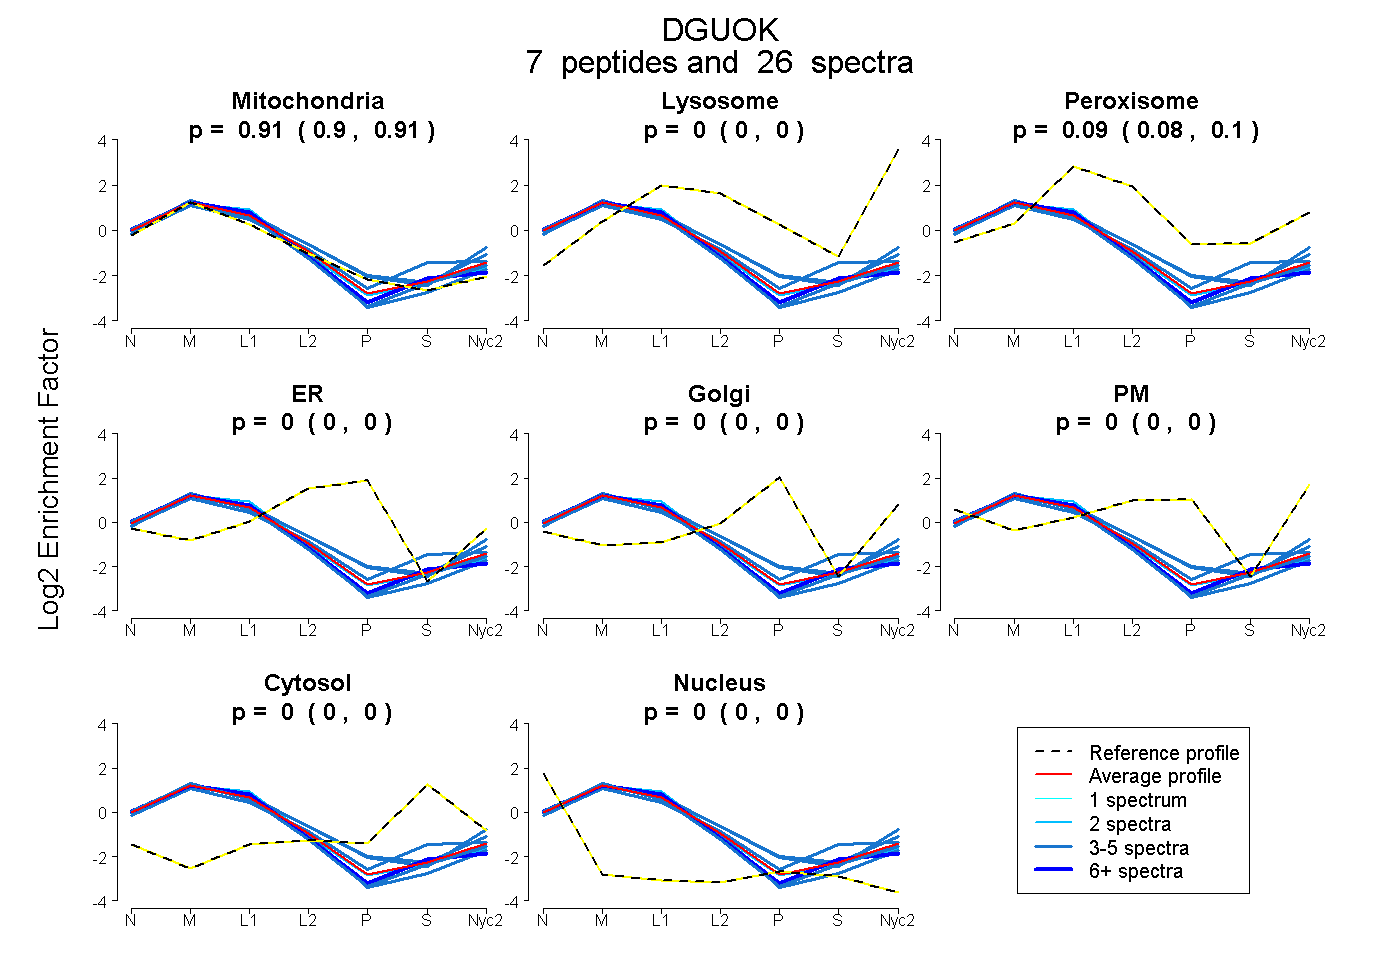
0.898 | 0.915
0.000 | 0.000
0.083 | 0.099
0.000 | 0.000
0.000 | 0.000
0.000 | 0.000
0.000 | 0.003
0.000 | 0.000
6peptides
spectra
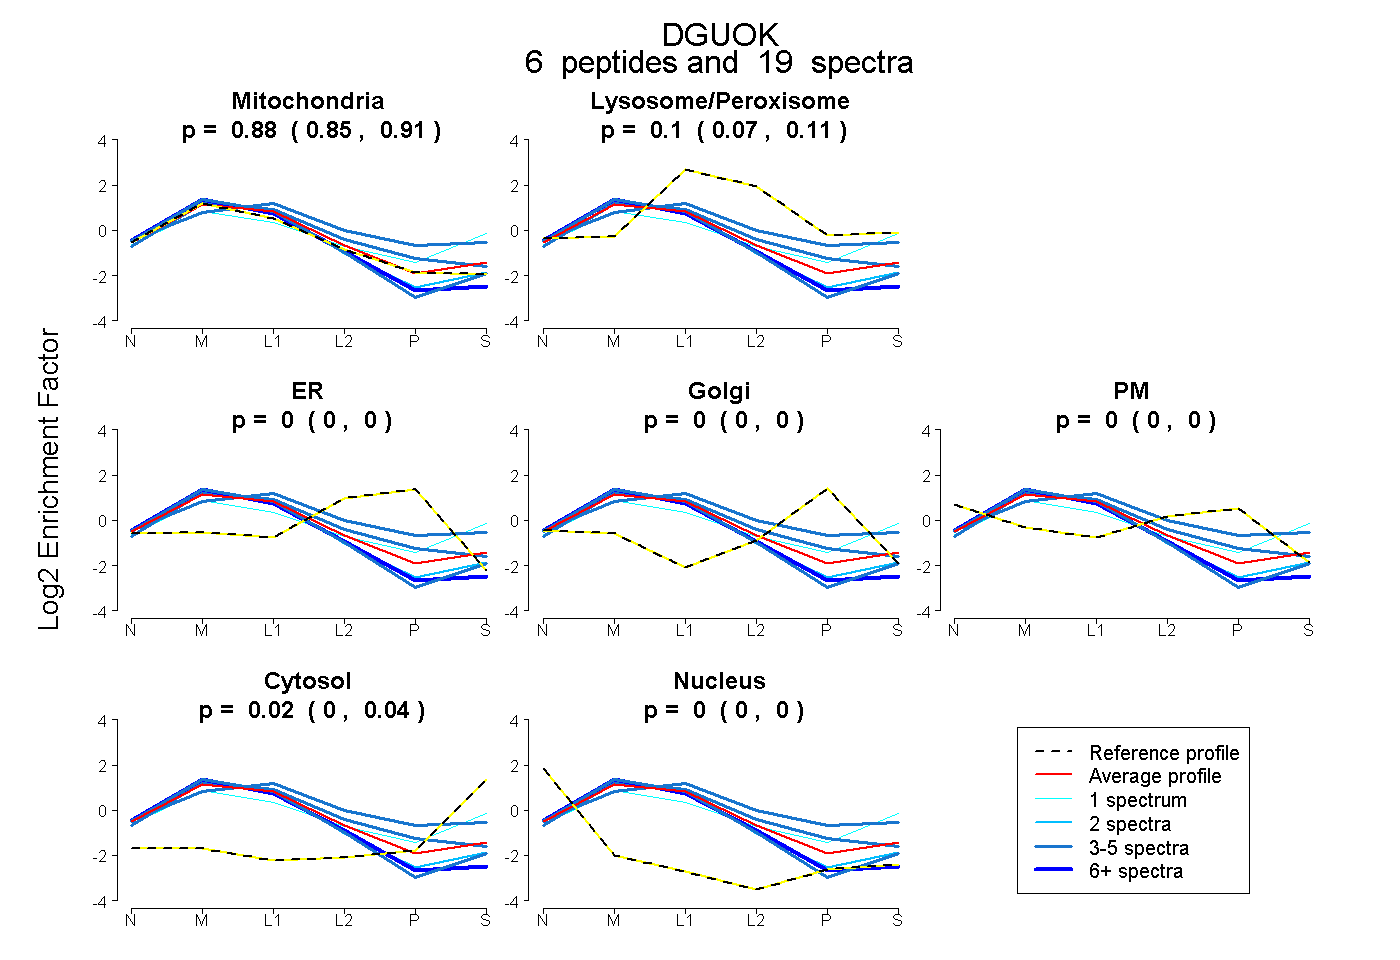
0.849 | 0.914
0.072 | 0.114
0.000 | 0.000
0.000 | 0.000
0.000 | 0.000
0.002 | 0.036
0.000 | 0.000
10peptides
spectra
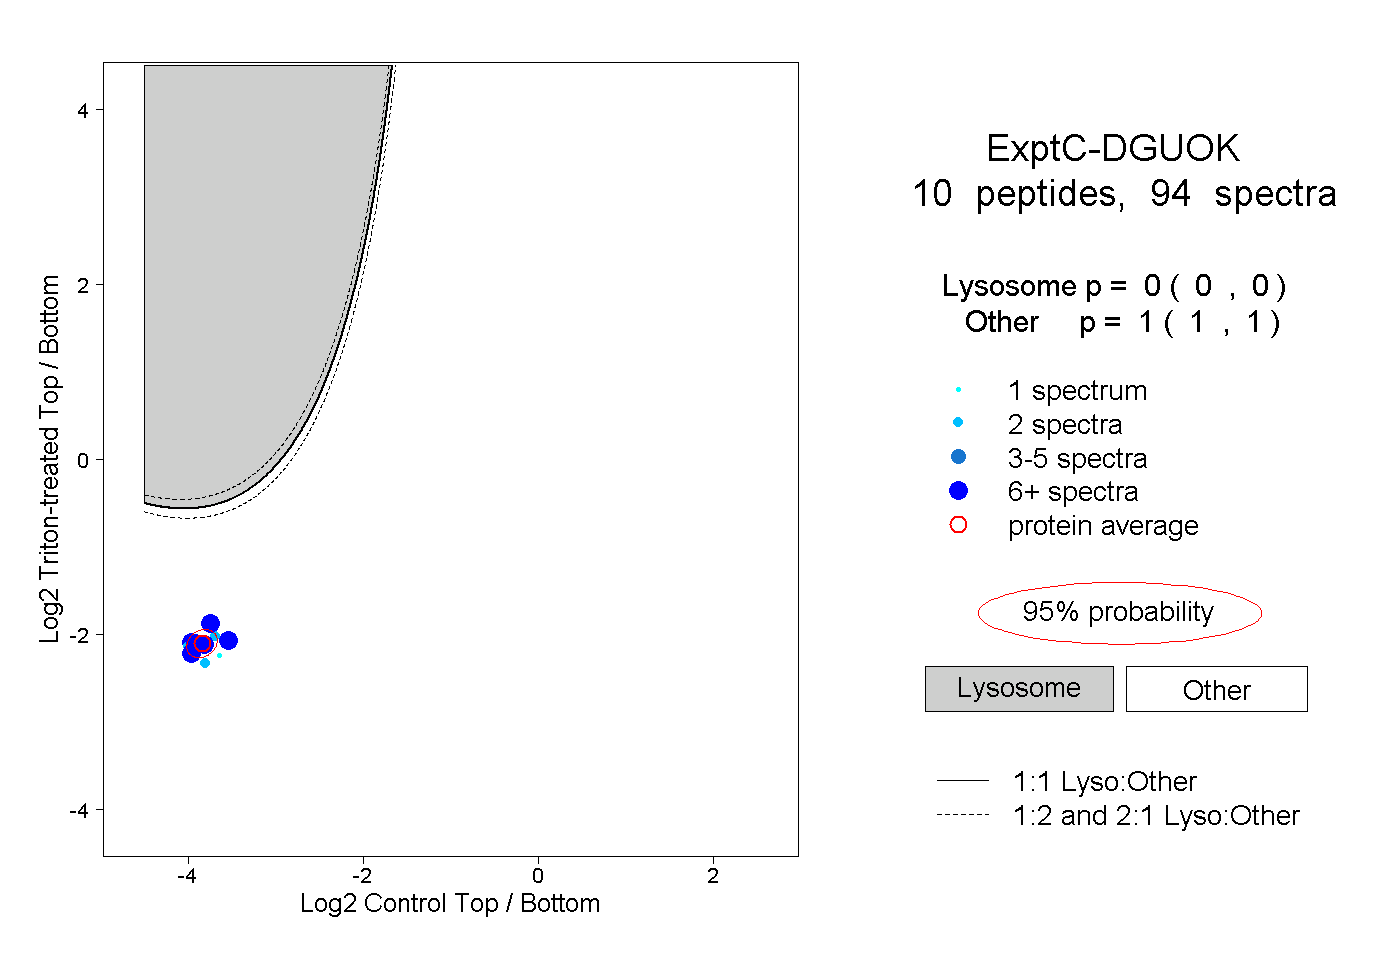
0.000 | 0.000
1.000 | 1.000
3peptides
spectra
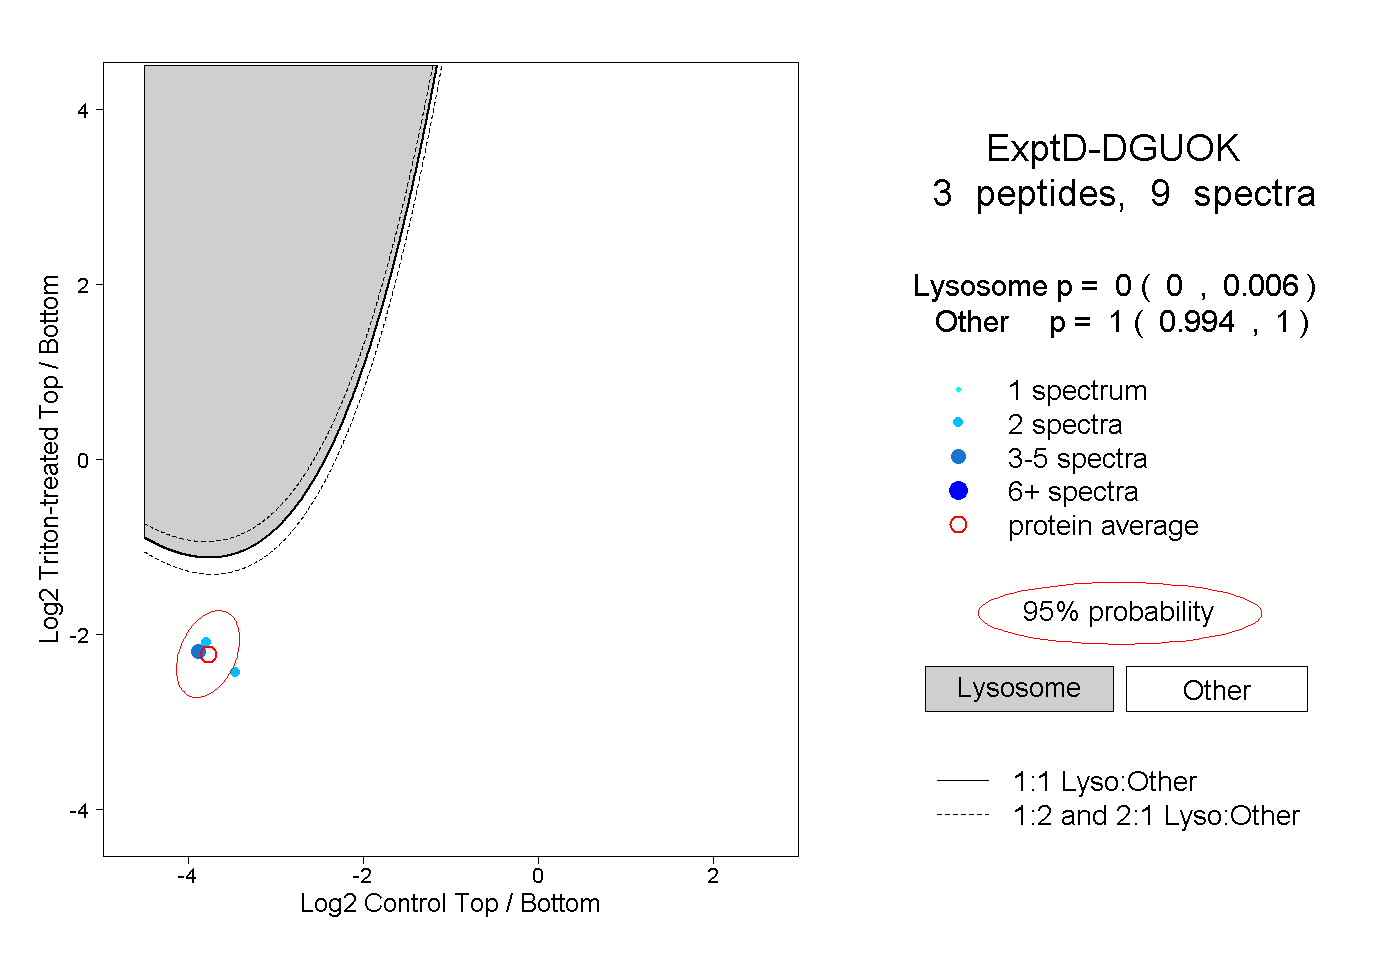
0.000 | 0.006
0.994 | 1.000