 7
7peptides
spectra
0.898 | 0.915
0.000 | 0.000
0.083 | 0.099
0.000 | 0.000
0.000 | 0.000
0.000 | 0.000
0.000 | 0.003
0.000 | 0.000
| Plot | Mito | Lyso | Perox | ER | Golgi | PM | Cytosol | Nucleus | |||||
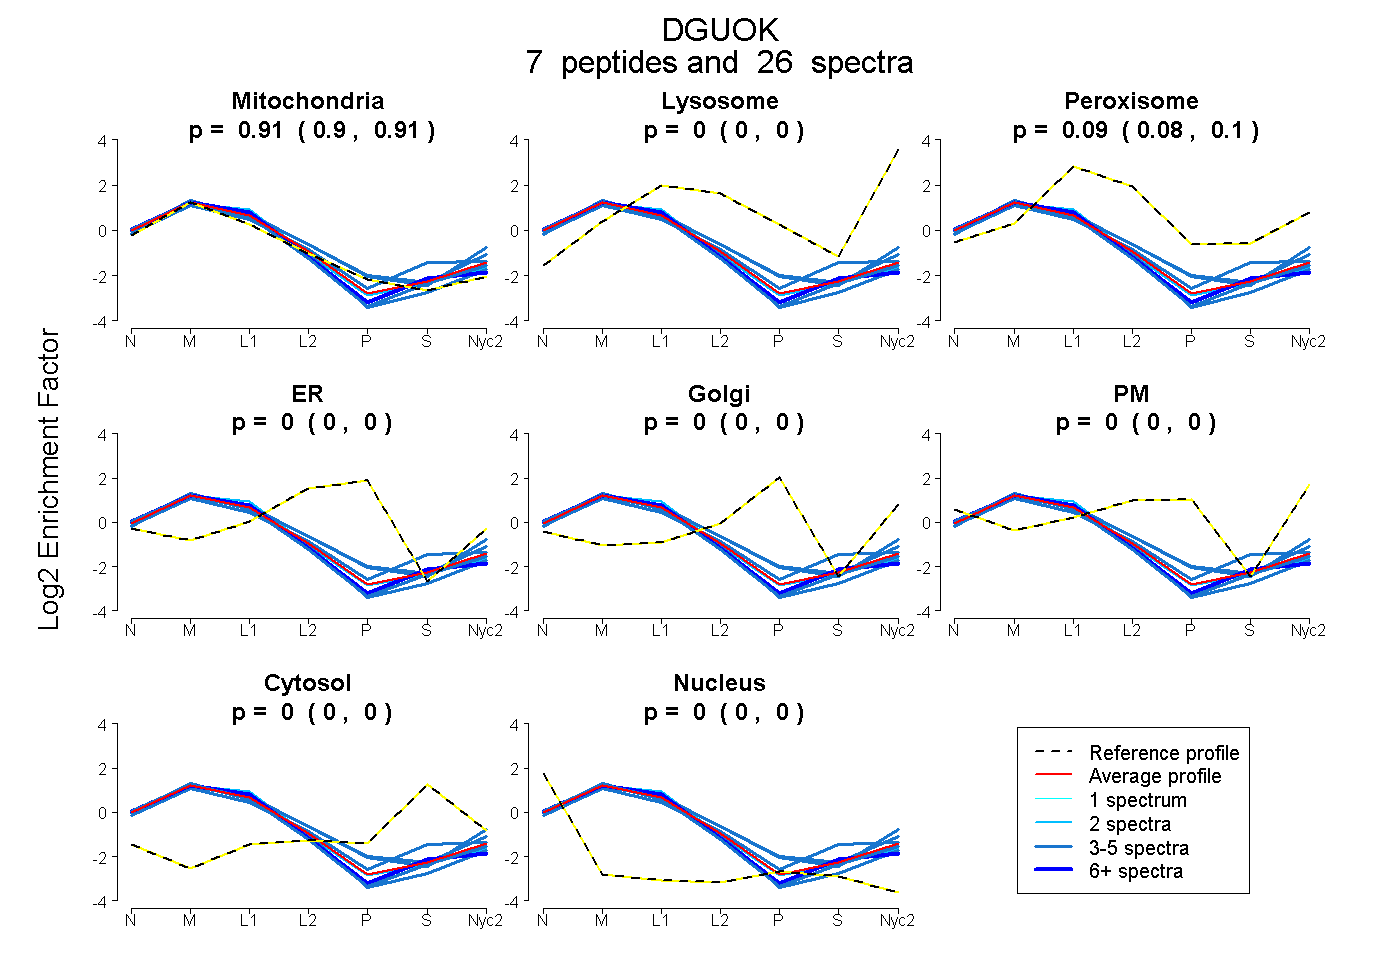
| Expt A |
7 peptides |
26 spectra |
|
0.908 0.898 | 0.915 |
0.000 0.000 | 0.000 |
0.092 0.083 | 0.099 |
0.000 0.000 | 0.000 |
0.000 0.000 | 0.000 |
0.000 0.000 | 0.000 |
0.000 0.000 | 0.003 |
0.000 0.000 | 0.000 |
| 4 spectra, LLQADTSVR | 1.000 | 0.000 | 0.000 | 0.000 | 0.000 | 0.000 | 0.000 | 0.000 | ||
| 3 spectra, LHFEALR | 0.770 | 0.000 | 0.118 | 0.000 | 0.000 | 0.000 | 0.112 | 0.000 | ||
| 7 spectra, SVYSDR | 0.972 | 0.000 | 0.026 | 0.000 | 0.000 | 0.000 | 0.002 | 0.000 | ||
| 3 spectra, VQLEPTPGR | 0.987 | 0.000 | 0.013 | 0.000 | 0.000 | 0.000 | 0.000 | 0.000 | ||
| 3 spectra, LGNLLDMMYQEPAR | 0.818 | 0.182 | 0.000 | 0.000 | 0.000 | 0.000 | 0.000 | 0.000 | ||
| 2 spectra, GIELAYLK | 0.928 | 0.000 | 0.072 | 0.000 | 0.000 | 0.000 | 0.000 | 0.000 | ||
| 4 spectra, QLHGQHEDWFINK | 0.801 | 0.079 | 0.101 | 0.000 | 0.000 | 0.011 | 0.000 | 0.008 |
| Plot | Mito | Lyso or Perox | ER | Golgi | PM | Cytosol | Nucleus | ||||||
| Expt B |
6 peptides |
19 spectra |
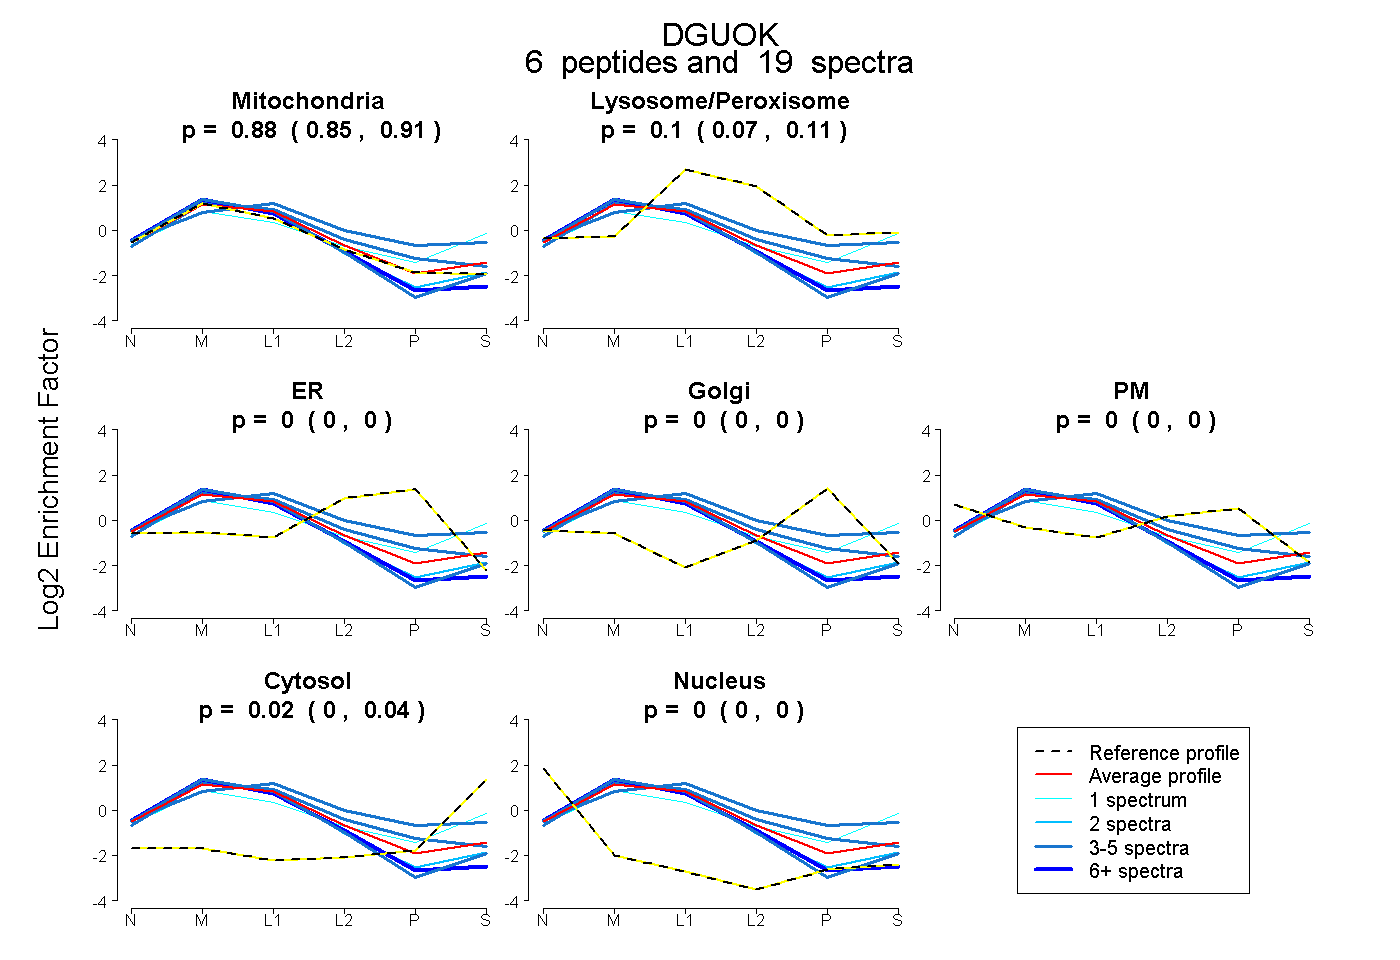 |
0.882 0.849 | 0.914 |
0.096 0.072 | 0.114 |
0.000 0.000 | 0.000 |
0.000 0.000 | 0.000 |
0.000 0.000 | 0.000 |
0.022 0.002 | 0.036 |
0.000 0.000 | 0.000 |
|||
| Plot | Lyso | Other | |||||||||||
| Expt C |
10 peptides |
94 spectra |
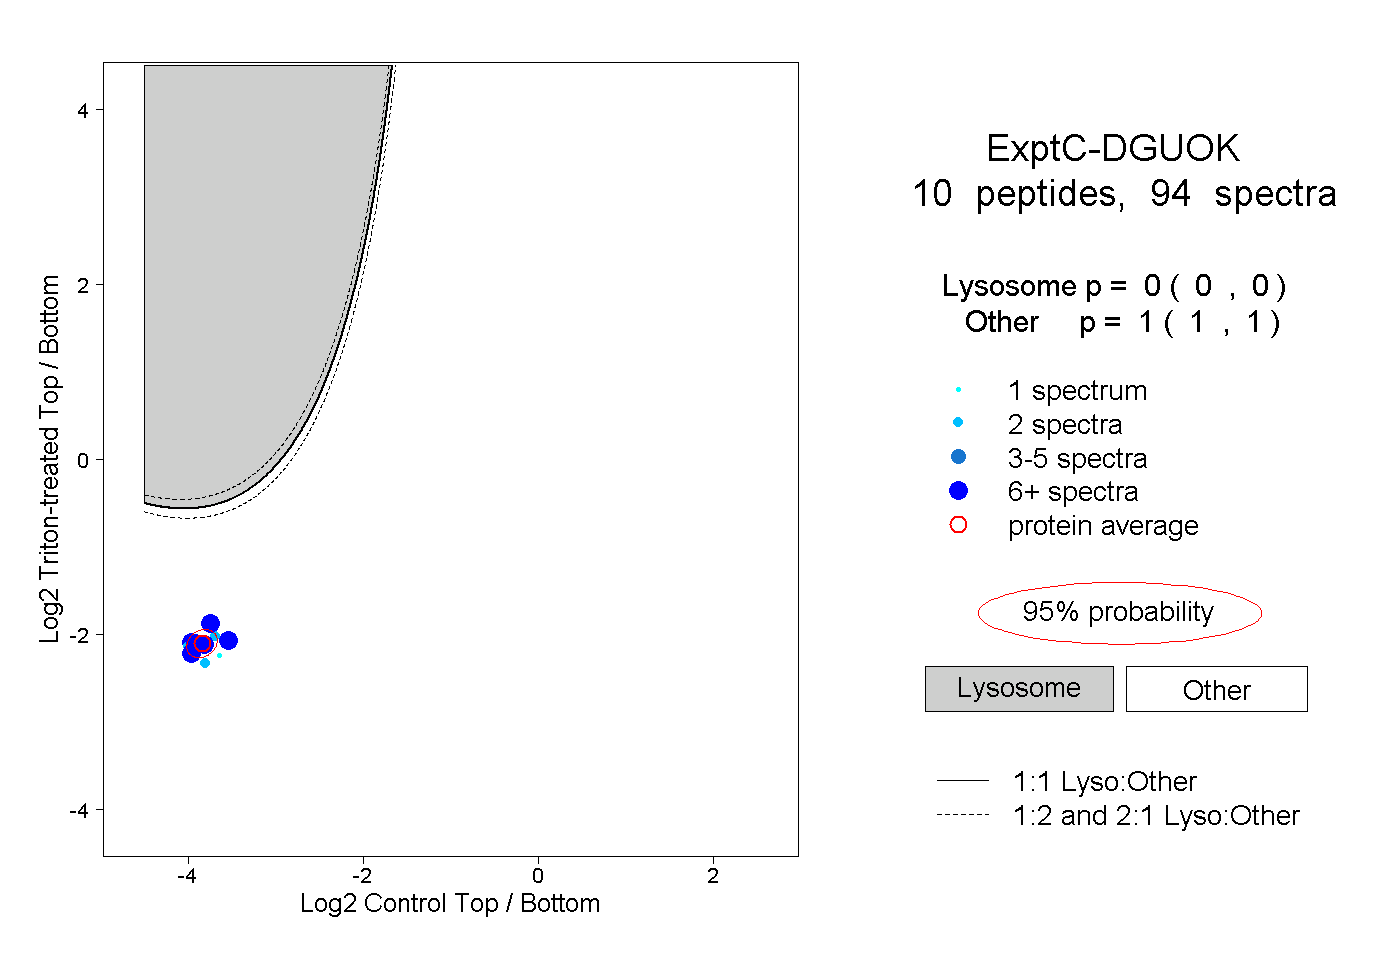 |
0.000 0.000 | 0.000 |
1.000 1.000 | 1.000 |
||||||||
| Plot | Lyso | Other | |||||||||||
| Expt D |
3 peptides |
9 spectra |
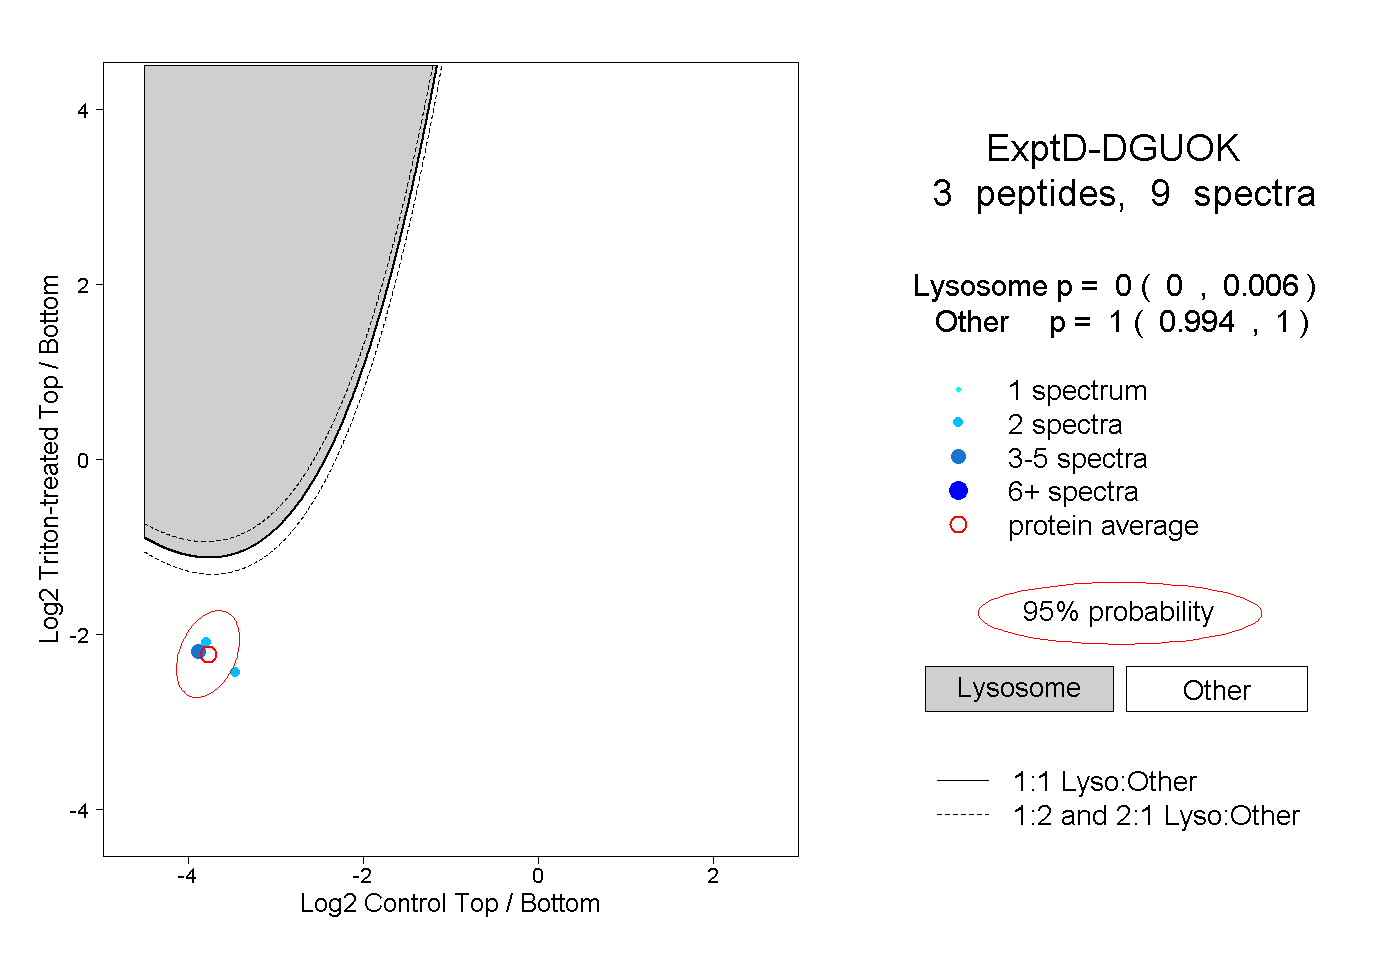 |
0.000 0.000 | 0.006 |
1.000 0.994 | 1.000 |