 11
11peptides
spectra
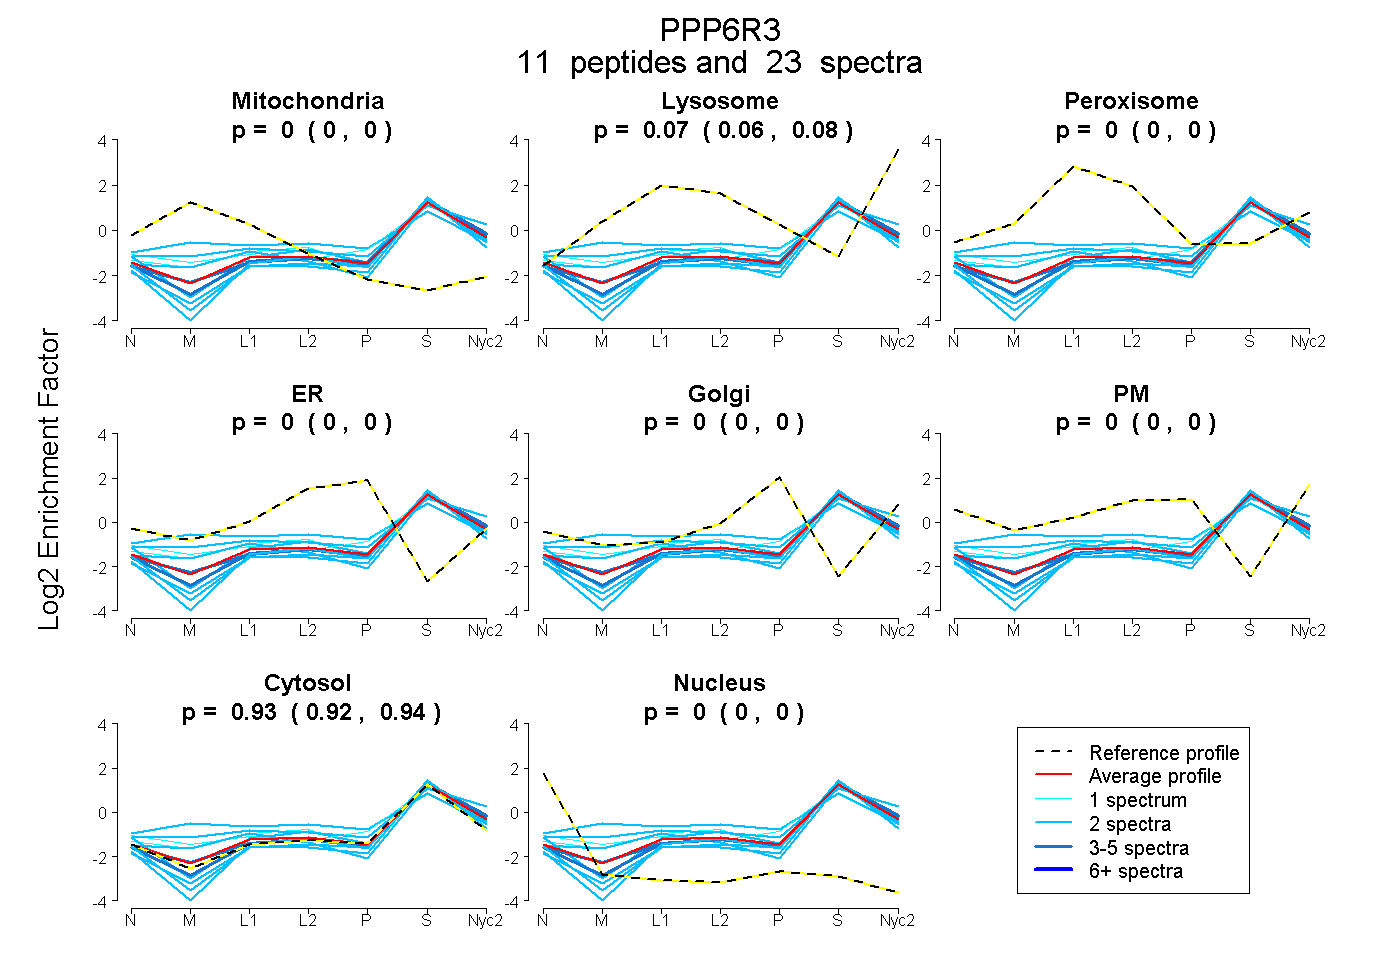
0.000 | 0.000
0.061 | 0.076
0.000 | 0.000
0.000 | 0.000
0.000 | 0.000
0.000 | 0.000
0.922 | 0.938
0.000 | 0.000
1peptide
spectrum
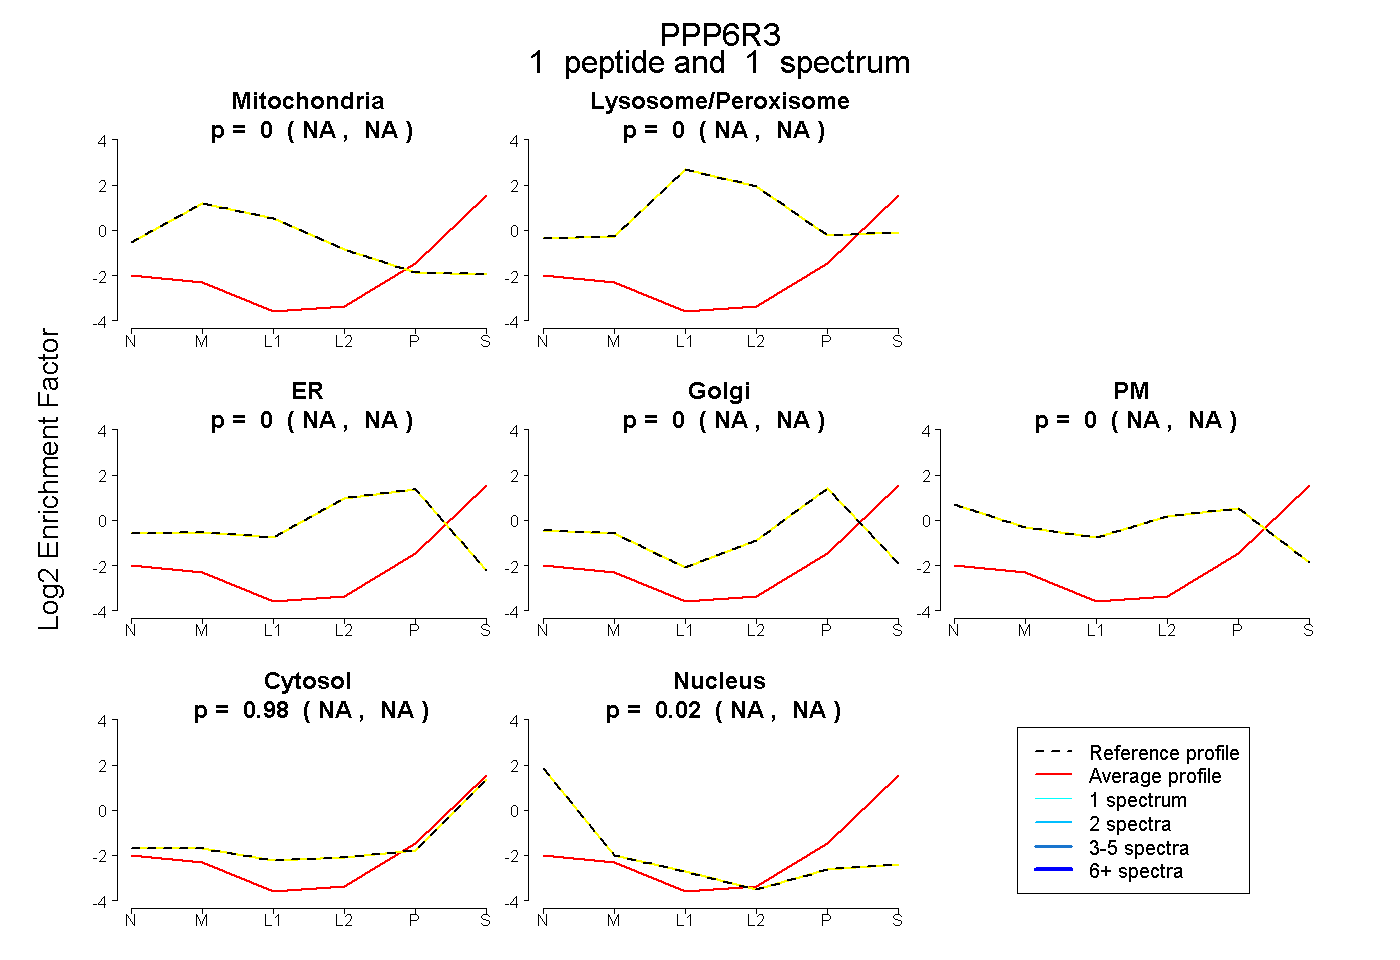
NA | NA
NA | NA
NA | NA
NA | NA
NA | NA
NA | NA
NA | NA
7peptides
spectra
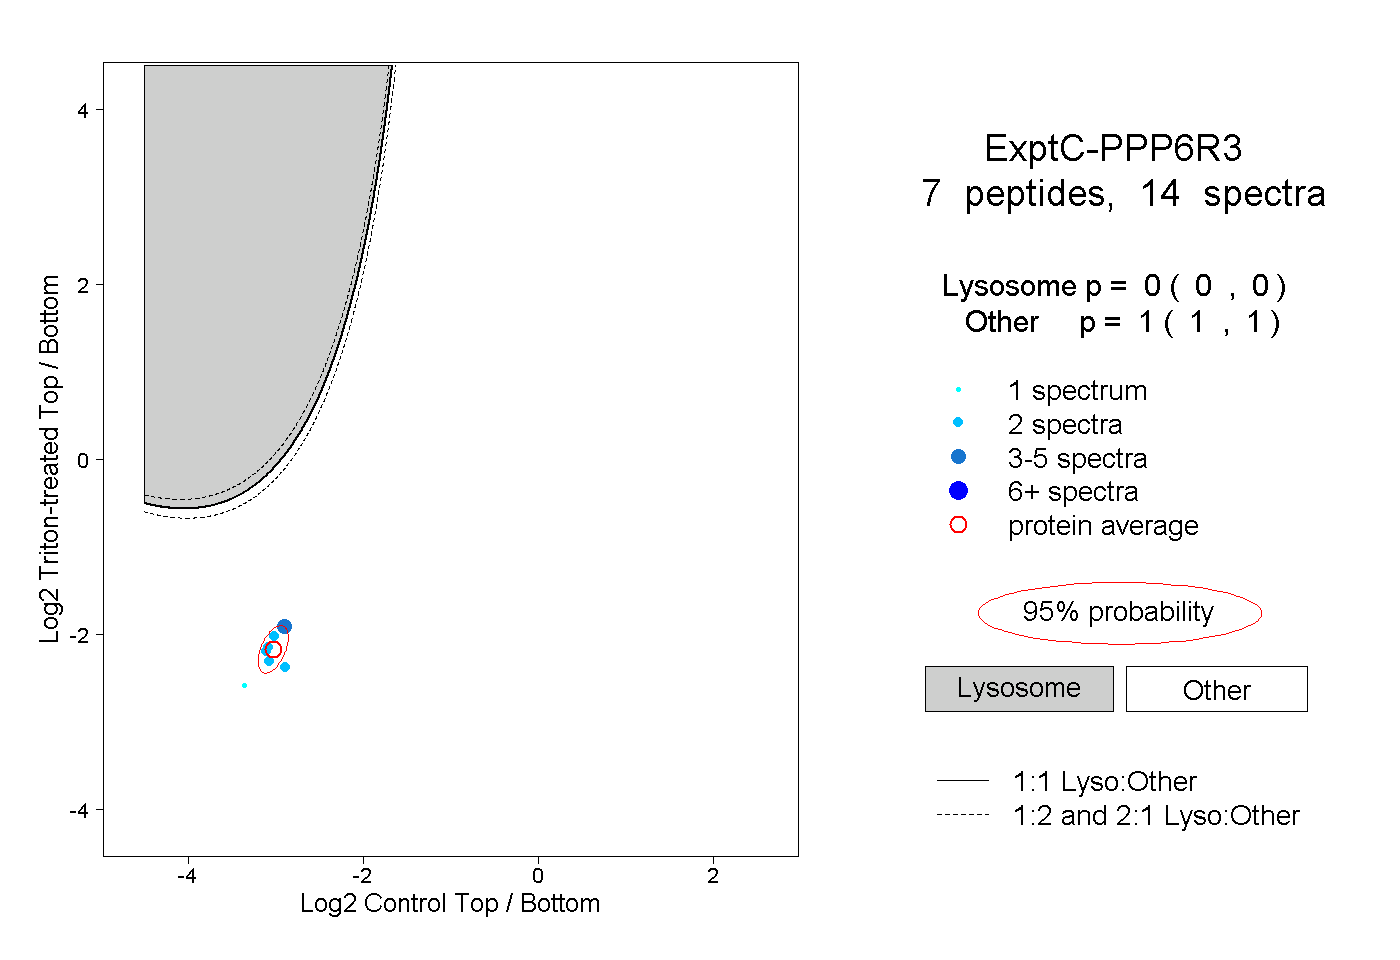
0.000 | 0.000
1.000 | 1.000
1peptide
spectrum
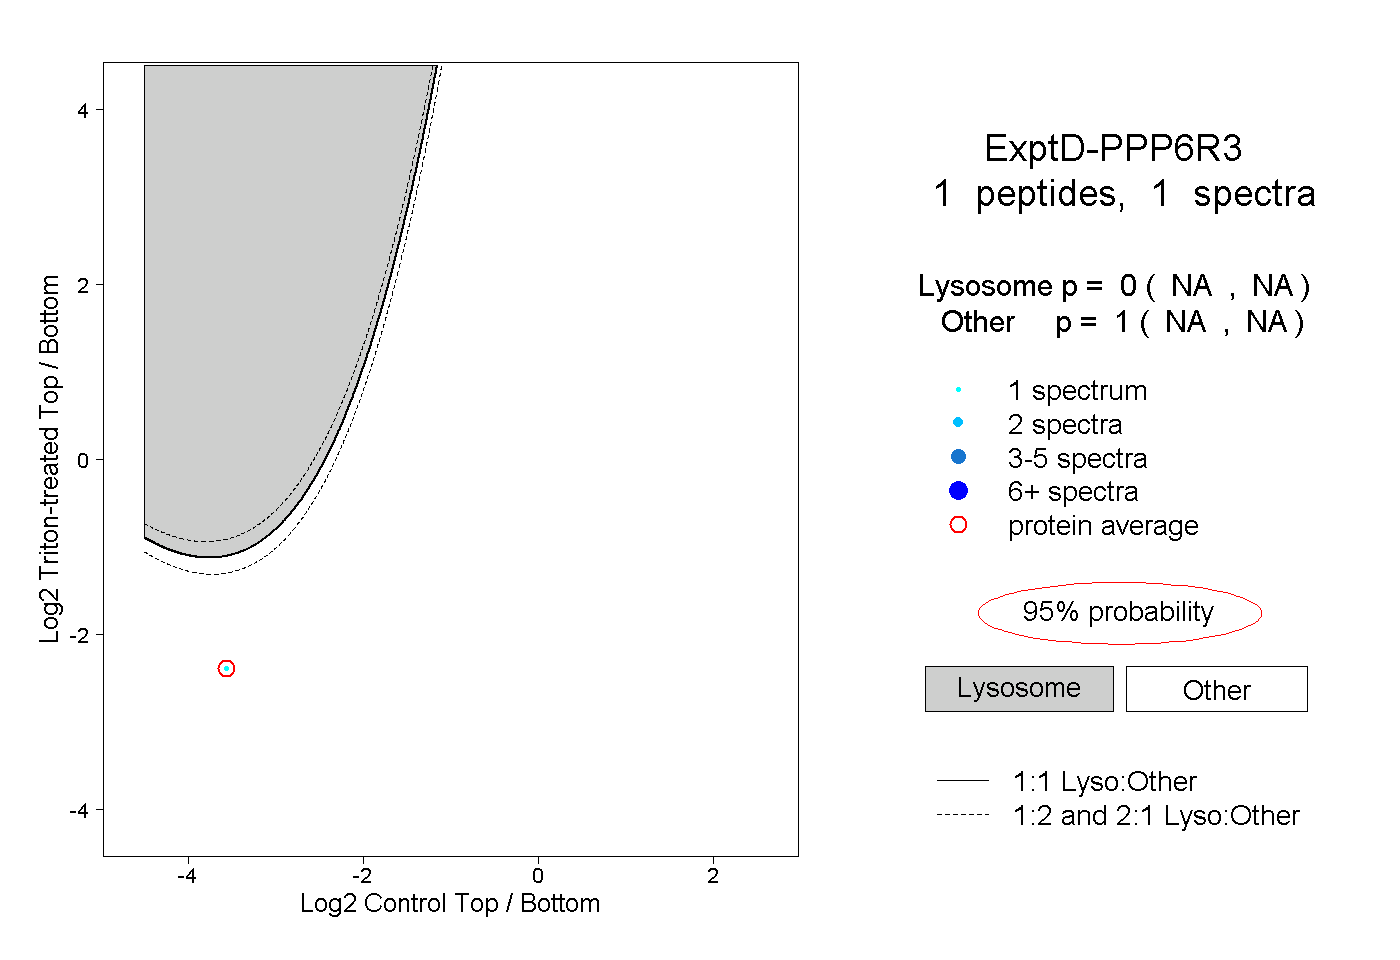
NA | NA
NA | NA