 11
11peptides
spectra
0.000 | 0.000
0.061 | 0.076
0.000 | 0.000
0.000 | 0.000
0.000 | 0.000
0.000 | 0.000
0.922 | 0.938
0.000 | 0.000
| Plot | Mito | Lyso | Perox | ER | Golgi | PM | Cytosol | Nucleus | |||||
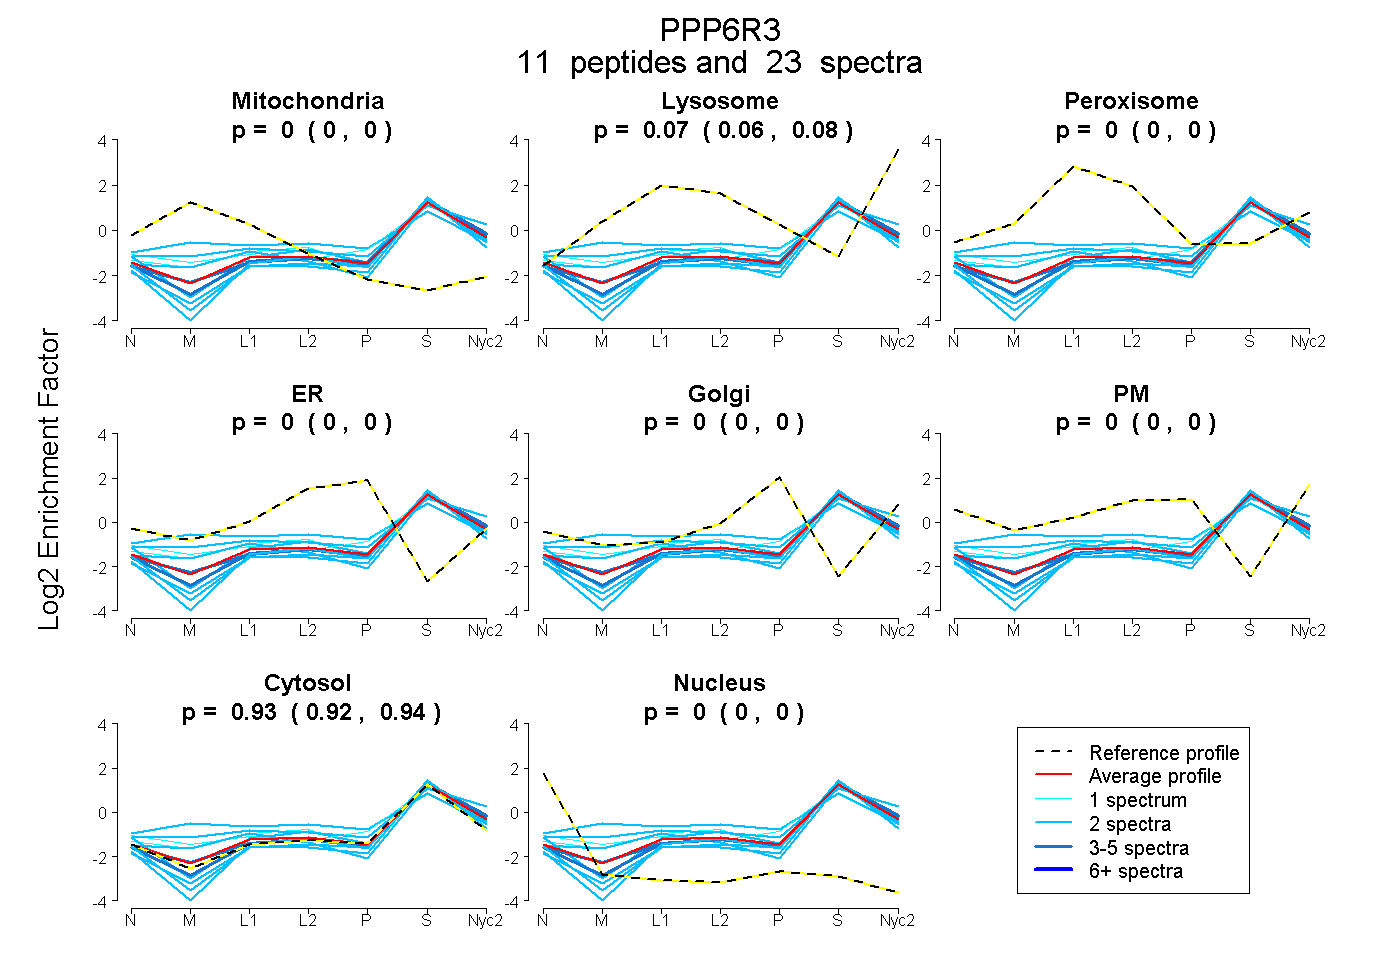
| Expt A |
11 peptides |
23 spectra |
|
0.000 0.000 | 0.000 |
0.069 0.061 | 0.076 |
0.000 0.000 | 0.000 |
0.000 0.000 | 0.000 |
0.000 0.000 | 0.000 |
0.000 0.000 | 0.000 |
0.931 0.922 | 0.938 |
0.000 0.000 | 0.000 |
| 2 spectra, TPNSSPEQR | 0.000 | 0.000 | 0.000 | 0.000 | 0.000 | 0.000 | 1.000 | 0.000 | ||
| 2 spectra, HIGTSALMDLLLR | 0.135 | 0.061 | 0.156 | 0.000 | 0.027 | 0.000 | 0.621 | 0.000 | ||
| 2 spectra, DFVDLIIK | 0.000 | 0.000 | 0.000 | 0.000 | 0.000 | 0.000 | 1.000 | 0.000 | ||
| 2 spectra, GLPDGVR | 0.000 | 0.000 | 0.040 | 0.000 | 0.000 | 0.003 | 0.957 | 0.000 | ||
| 4 spectra, LGEDESLLMK | 0.000 | 0.038 | 0.000 | 0.000 | 0.000 | 0.000 | 0.962 | 0.000 | ||
| 2 spectra, LIEFLLK | 0.085 | 0.058 | 0.000 | 0.000 | 0.000 | 0.000 | 0.858 | 0.000 | ||
| 2 spectra, SVLEAIR | 0.000 | 0.000 | 0.000 | 0.000 | 0.000 | 0.000 | 1.000 | 0.000 | ||
| 3 spectra, QDVLNWLNEER | 0.000 | 0.064 | 0.000 | 0.000 | 0.000 | 0.000 | 0.936 | 0.000 | ||
| 1 spectrum, DQMLQVQNSTEPDPLLATLEK | 0.021 | 0.062 | 0.088 | 0.000 | 0.000 | 0.000 | 0.828 | 0.000 | ||
| 2 spectra, VLSILISR | 0.045 | 0.213 | 0.000 | 0.000 | 0.000 | 0.000 | 0.742 | 0.000 | ||
| 1 spectrum, ILDAWDTNEK | 0.045 | 0.111 | 0.000 | 0.000 | 0.040 | 0.003 | 0.801 | 0.000 |
| Plot | Mito | Lyso or Perox | ER | Golgi | PM | Cytosol | Nucleus | ||||||
| Expt B |
1 peptide |
1 spectrum |
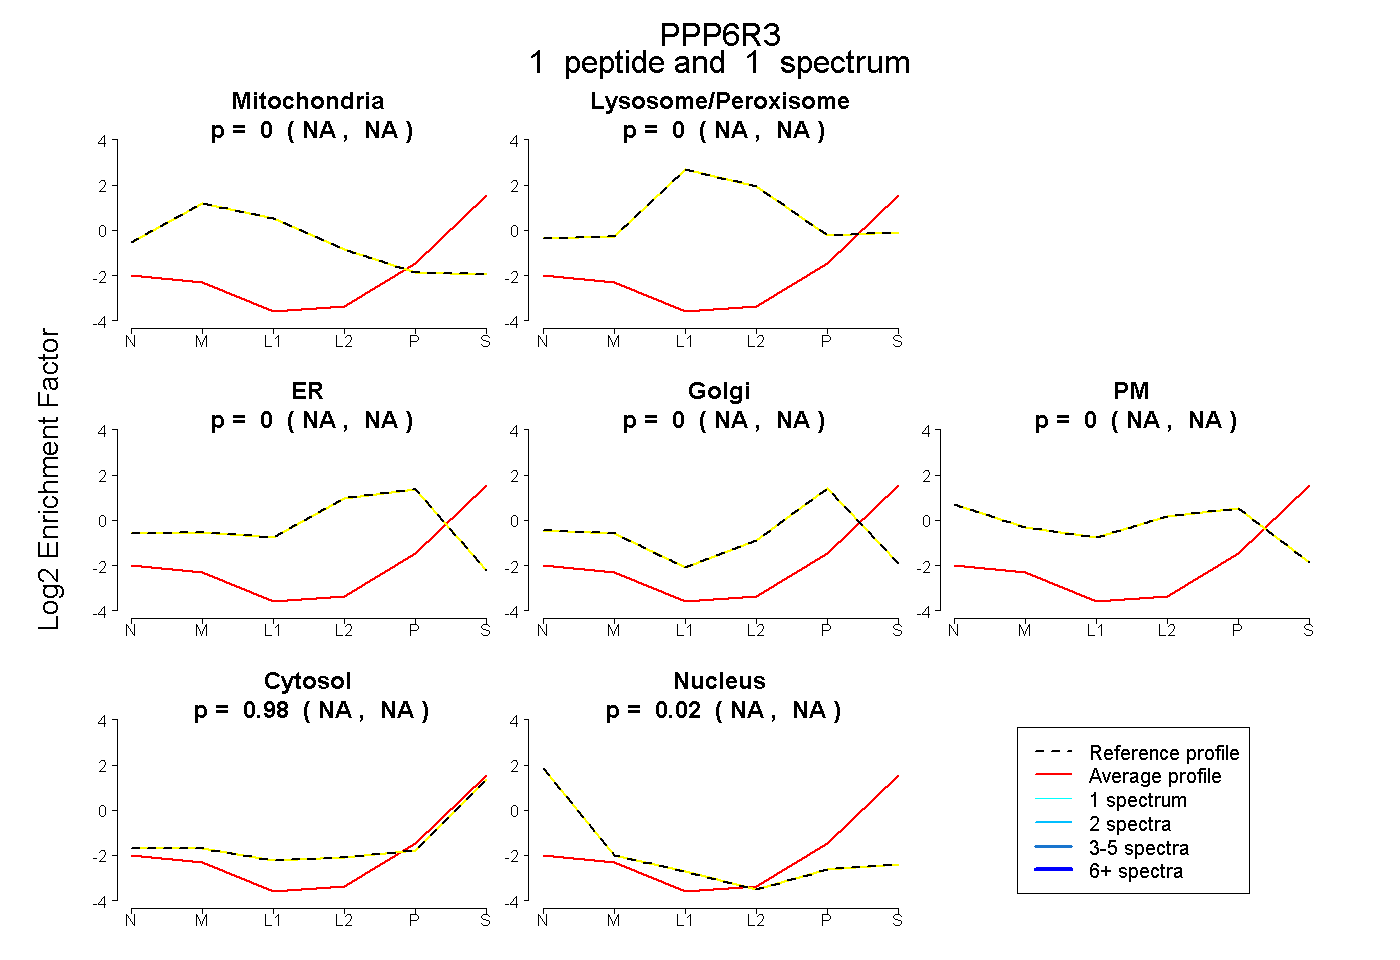 |
0.000 NA | NA |
0.000 NA | NA |
0.000 NA | NA |
0.000 NA | NA |
0.000 NA | NA |
0.976 NA | NA |
0.024 NA | NA |
|||
| Plot | Lyso | Other | |||||||||||
| Expt C |
7 peptides |
14 spectra |
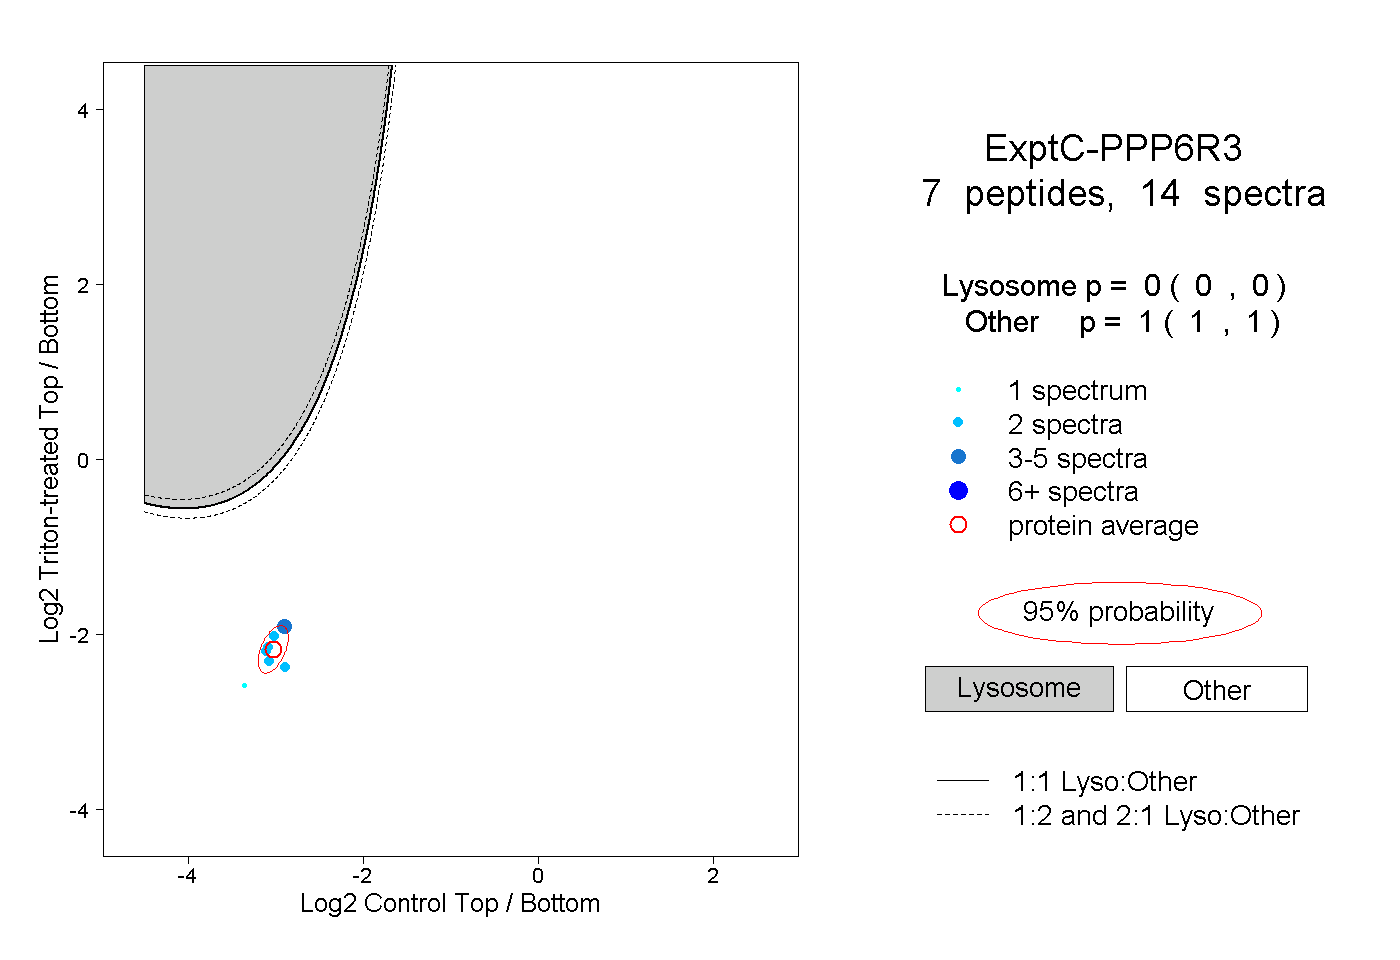 |
0.000 0.000 | 0.000 |
1.000 1.000 | 1.000 |
||||||||
| Plot | Lyso | Other | |||||||||||
| Expt D |
1 peptide |
1 spectrum |
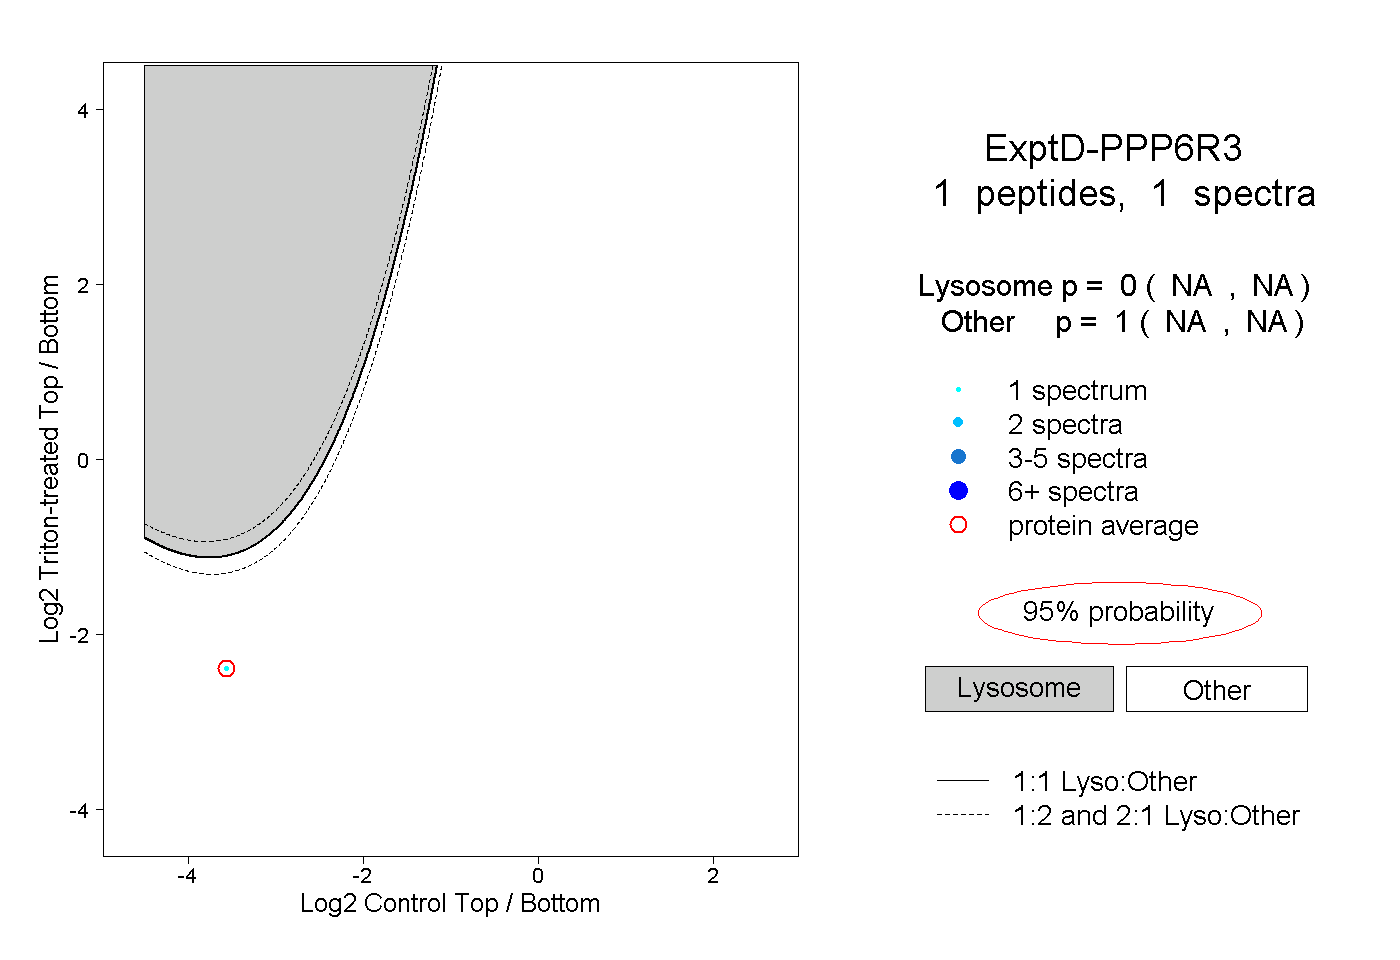 |
0.000 NA | NA |
1.000 NA | NA |