 16
16peptides
spectra
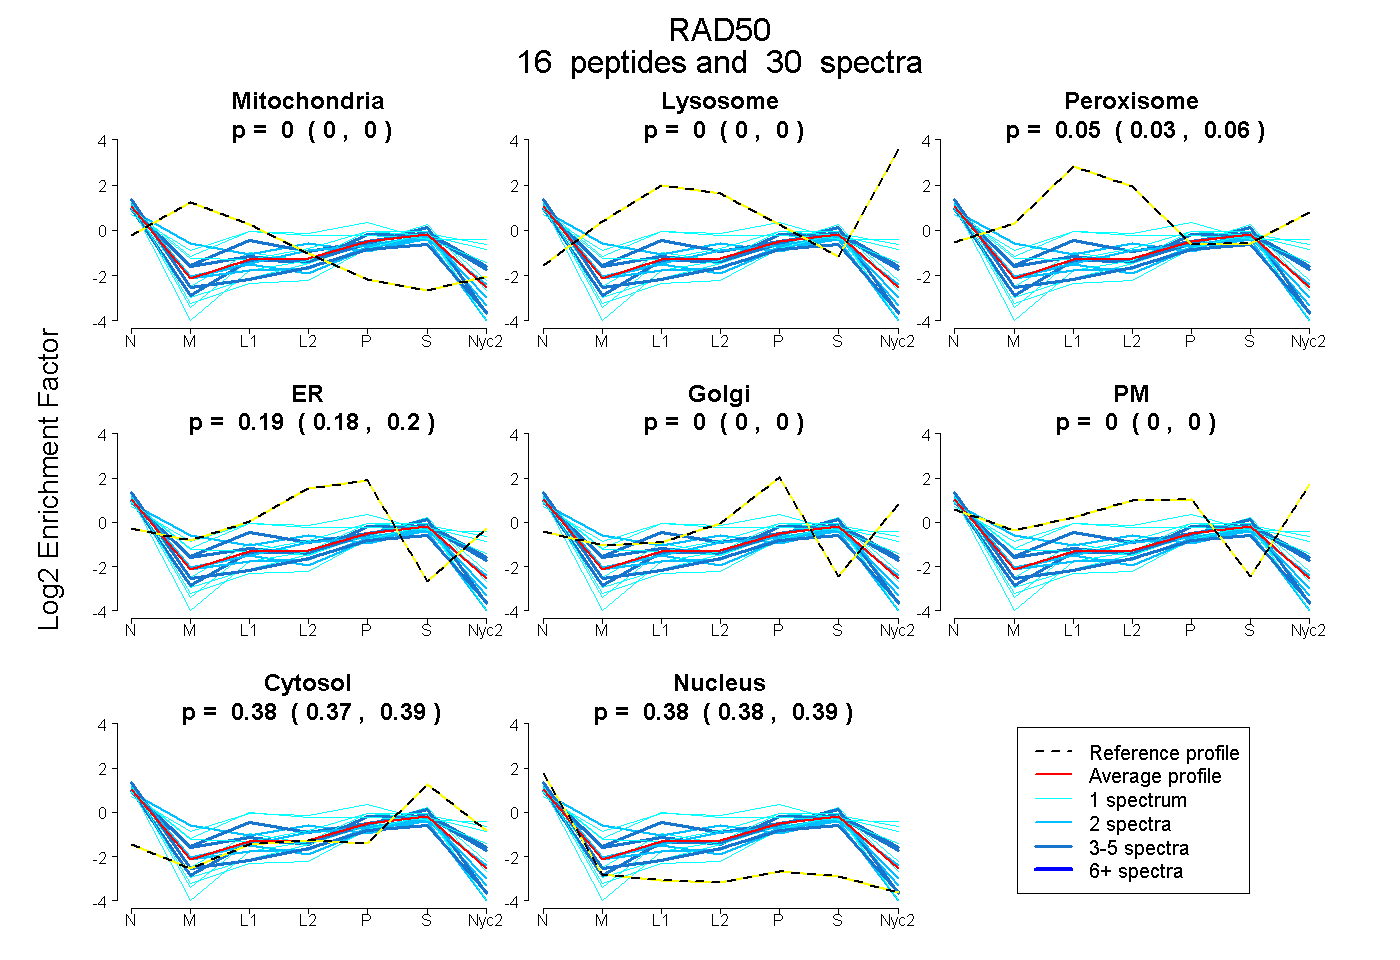
0.000 | 0.000
0.000 | 0.000
0.032 | 0.057
0.177 | 0.195
0.000 | 0.000
0.000 | 0.000
0.375 | 0.392
0.376 | 0.390
5peptides
spectra
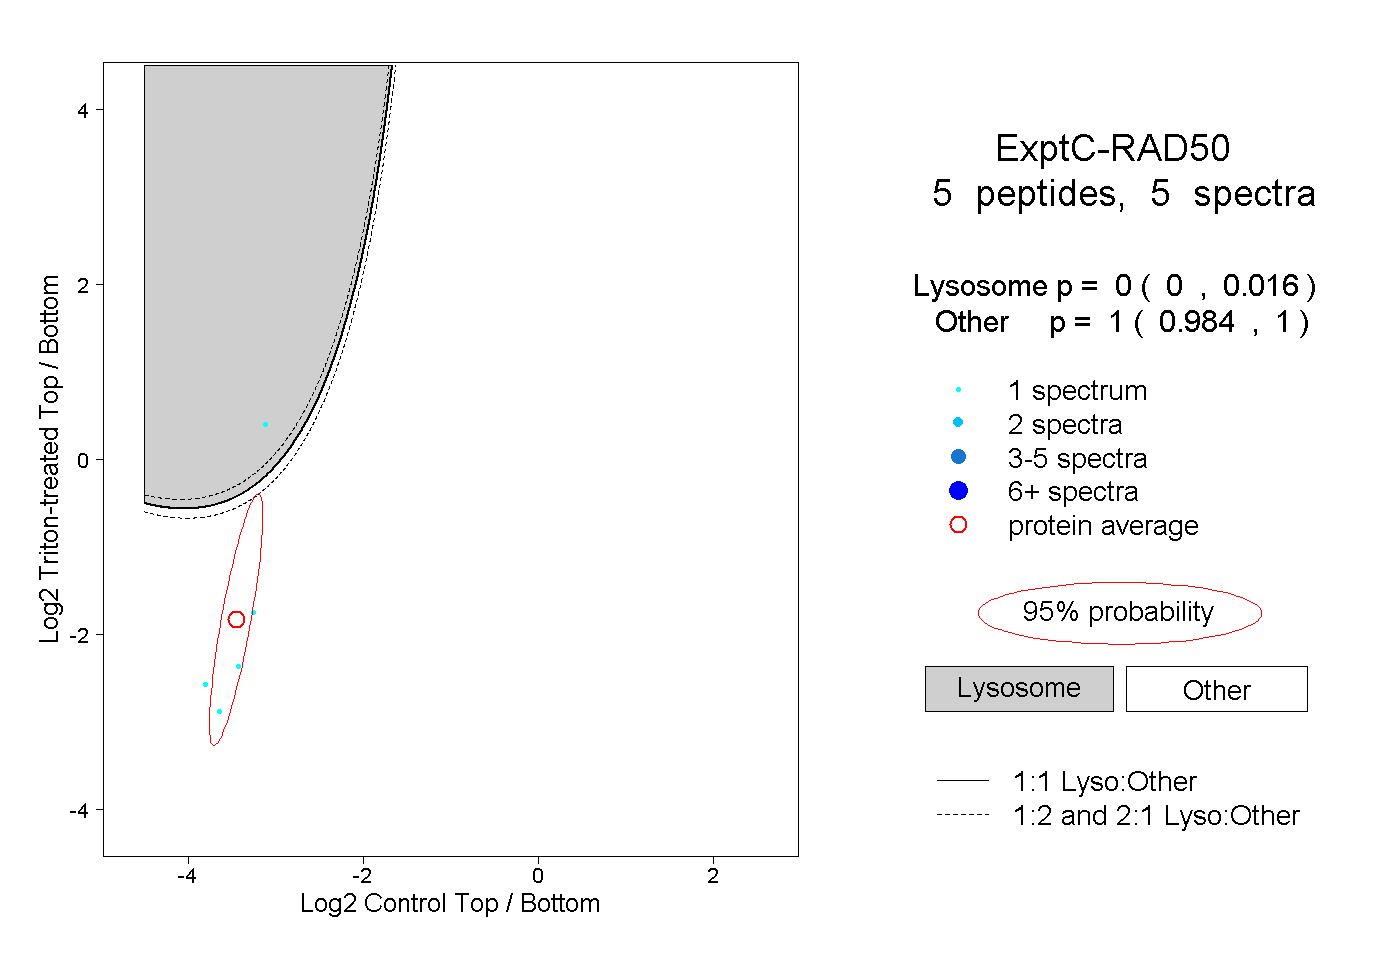
0.000 | 0.016
0.984 | 1.000
1peptide
spectrum
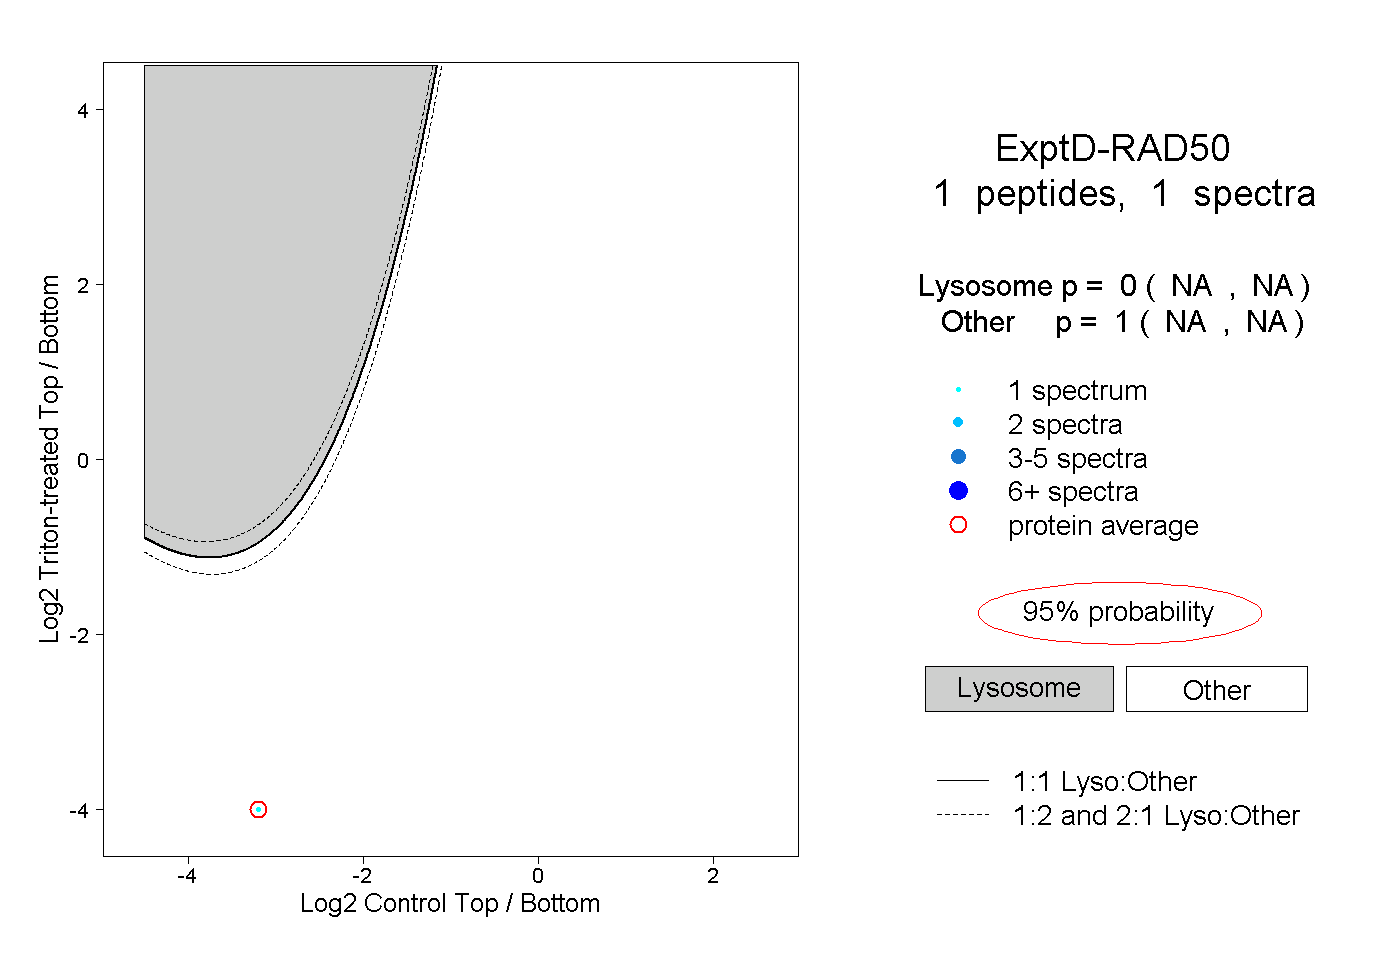
NA | NA
NA | NA