 16
16peptides
spectra
0.000 | 0.000
0.000 | 0.000
0.032 | 0.057
0.177 | 0.195
0.000 | 0.000
0.000 | 0.000
0.375 | 0.392
0.376 | 0.390
| Plot | Mito | Lyso | Perox | ER | Golgi | PM | Cytosol | Nucleus | |||||
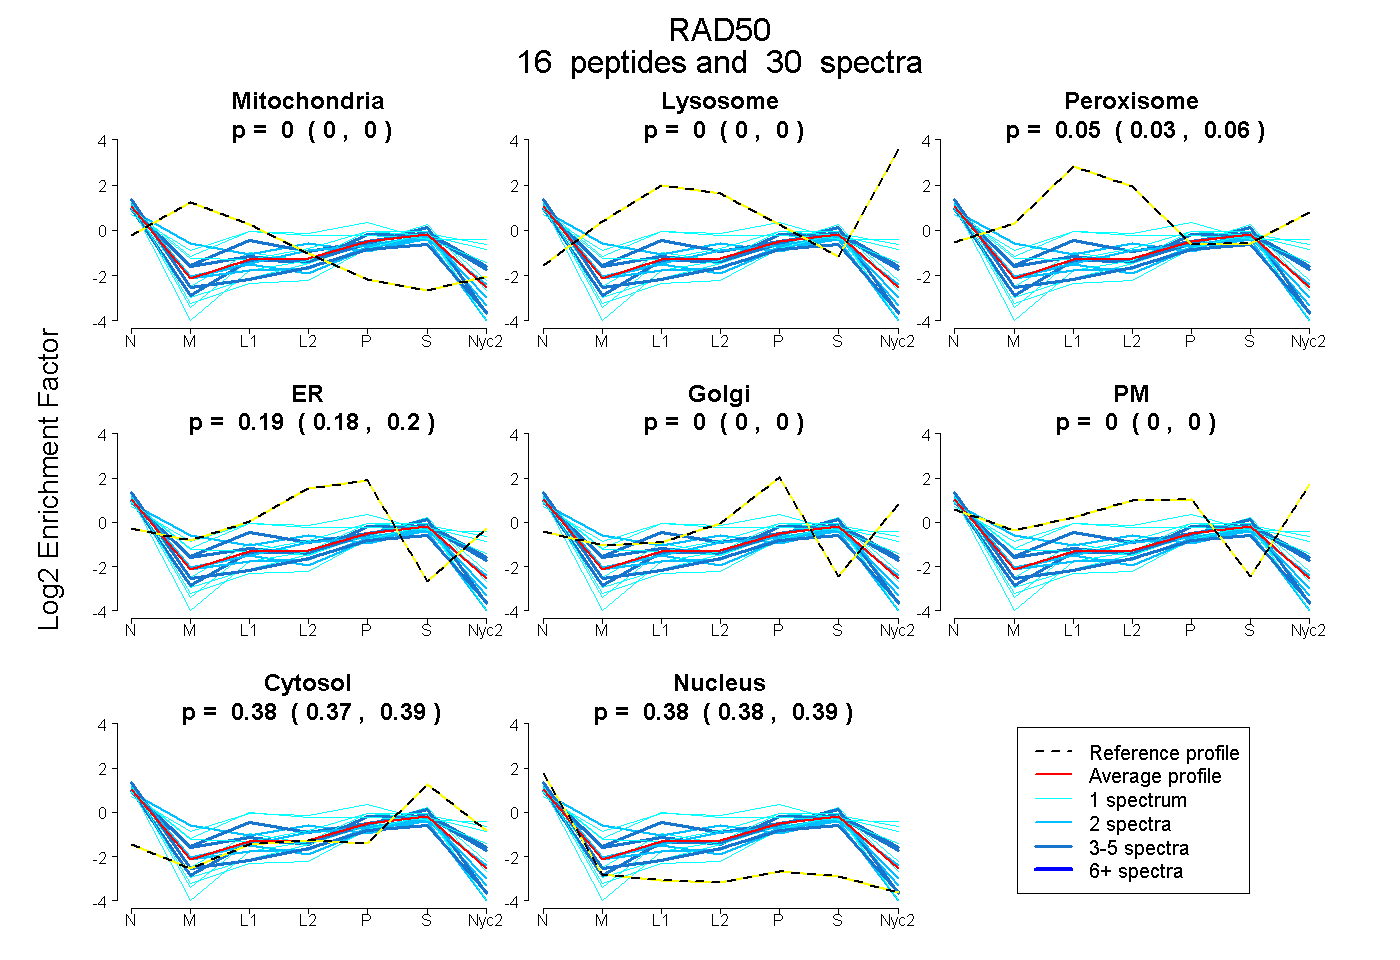
| Expt A |
16 peptides |
30 spectra |
|
0.000 0.000 | 0.000 |
0.000 0.000 | 0.000 |
0.045 0.032 | 0.057 |
0.187 0.177 | 0.195 |
0.000 0.000 | 0.000 |
0.000 0.000 | 0.000 |
0.384 0.375 | 0.392 |
0.383 0.376 | 0.390 |
| 1 spectrum, TLDHAIMK | 0.000 | 0.000 | 0.194 | 0.122 | 0.000 | 0.286 | 0.279 | 0.119 | ||
| 1 spectrum, DVNGEMVLVQR | 0.000 | 0.000 | 0.000 | 0.000 | 0.000 | 0.230 | 0.495 | 0.275 | ||
| 2 spectra, NFHELVR | 0.000 | 0.000 | 0.060 | 0.180 | 0.000 | 0.000 | 0.337 | 0.423 | ||
| 1 spectrum, ALDTLR | 0.000 | 0.000 | 0.096 | 0.106 | 0.000 | 0.000 | 0.445 | 0.354 | ||
| 4 spectra, DLDIYYK | 0.000 | 0.000 | 0.103 | 0.096 | 0.125 | 0.000 | 0.359 | 0.317 | ||
| 1 spectrum, WLQDNLTLR | 0.000 | 0.000 | 0.343 | 0.178 | 0.000 | 0.000 | 0.207 | 0.272 | ||
| 3 spectra, LQIATNLQR | 0.000 | 0.000 | 0.260 | 0.111 | 0.000 | 0.000 | 0.318 | 0.310 | ||
| 1 spectrum, SDADENVSASDK | 0.000 | 0.000 | 0.000 | 0.043 | 0.000 | 0.349 | 0.405 | 0.202 | ||
| 2 spectra, AYENELEPLK | 0.193 | 0.000 | 0.144 | 0.115 | 0.000 | 0.000 | 0.266 | 0.282 | ||
| 4 spectra, GYEEEILHFK | 0.000 | 0.000 | 0.000 | 0.123 | 0.000 | 0.000 | 0.445 | 0.432 | ||
| 2 spectra, QLEDWLHSK | 0.000 | 0.000 | 0.000 | 0.141 | 0.000 | 0.000 | 0.304 | 0.555 | ||
| 1 spectrum, VAQETDVR | 0.000 | 0.000 | 0.000 | 0.000 | 0.000 | 0.000 | 0.404 | 0.596 | ||
| 1 spectrum, EAQLASSR | 0.000 | 0.000 | 0.000 | 0.090 | 0.000 | 0.000 | 0.518 | 0.392 | ||
| 2 spectra, EQINPLEIALEK | 0.000 | 0.000 | 0.042 | 0.098 | 0.000 | 0.000 | 0.351 | 0.509 | ||
| 1 spectrum, MSILGVR | 0.000 | 0.000 | 0.000 | 0.109 | 0.000 | 0.000 | 0.403 | 0.488 | ||
| 3 spectra, VLASLIIR | 0.000 | 0.000 | 0.000 | 0.128 | 0.000 | 0.000 | 0.295 | 0.577 |
| Plot | Lyso | Other | |||||||||||
| Expt C |
5 peptides |
5 spectra |
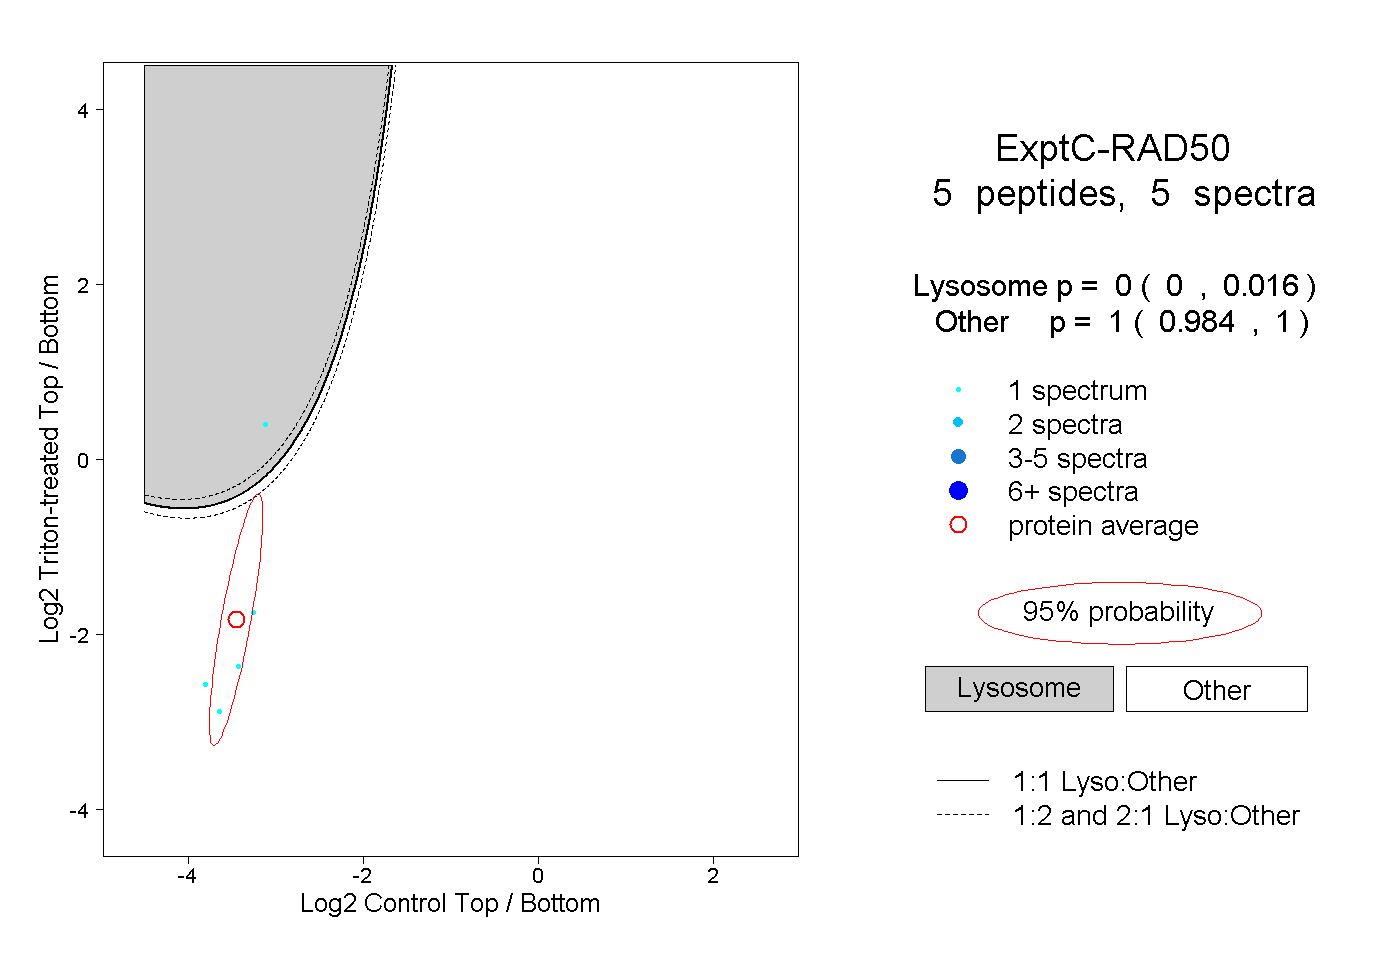 |
0.000 0.000 | 0.016 |
1.000 0.984 | 1.000 |
||||||||
| Plot | Lyso | Other | |||||||||||
| Expt D |
1 peptide |
1 spectrum |
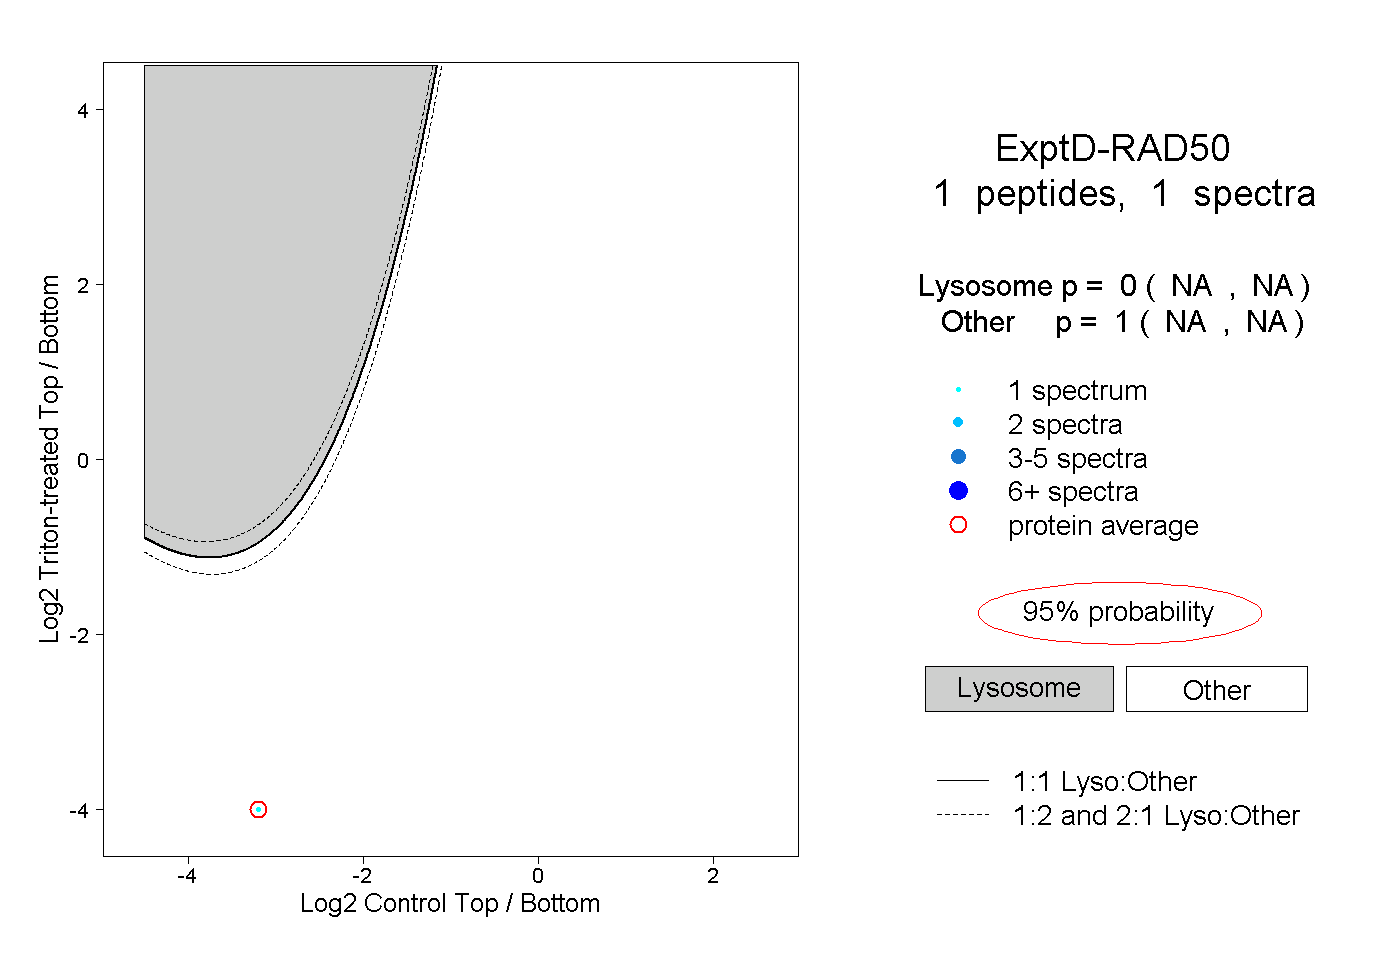 |
0.000 NA | NA |
1.000 NA | NA |