 5
5peptides
spectra
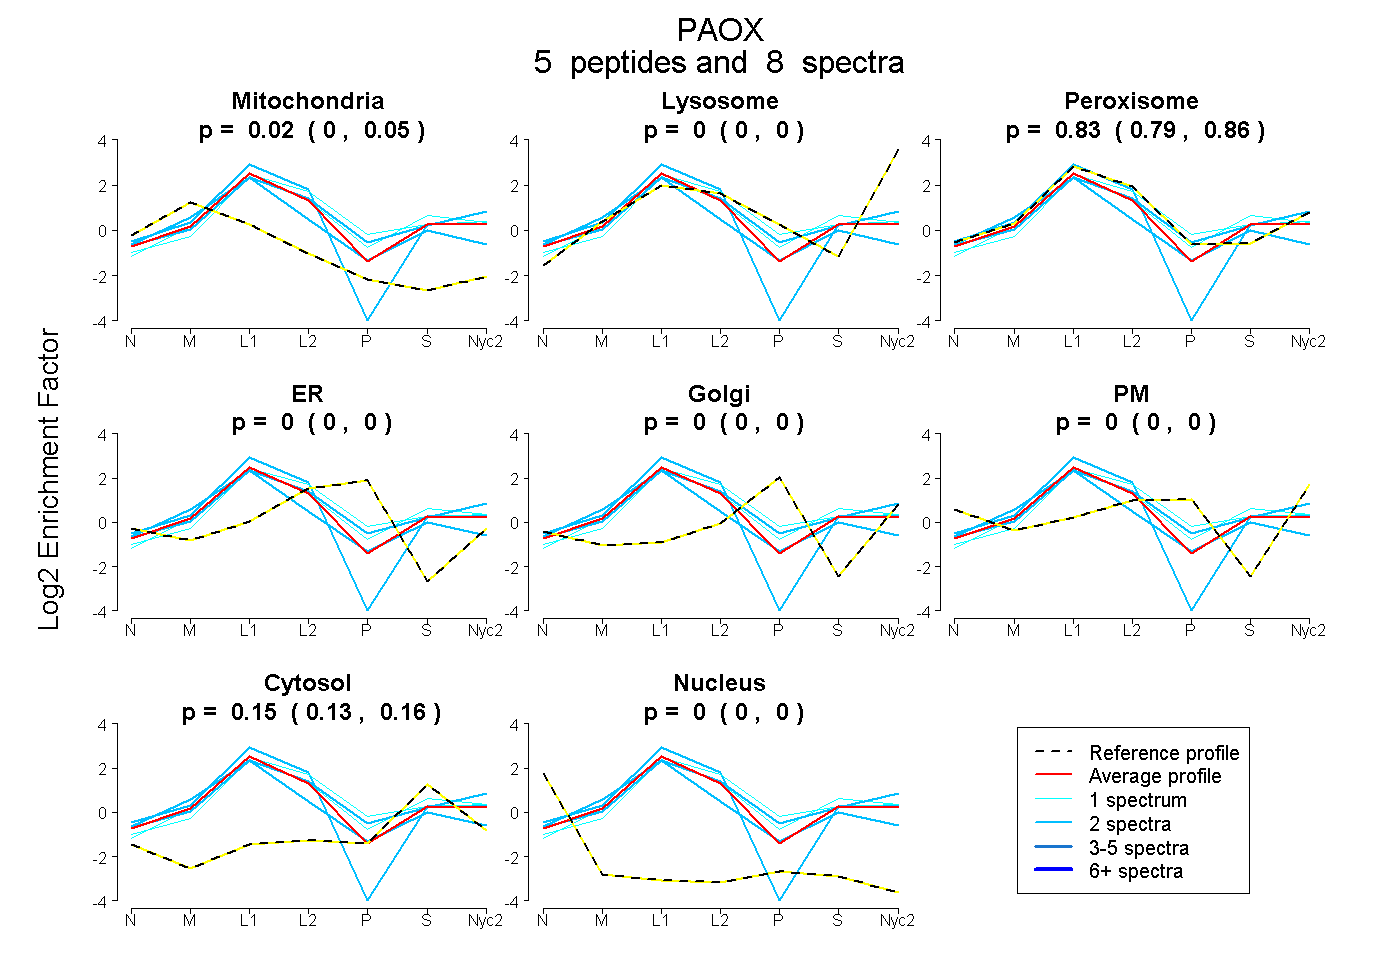
0.000 | 0.054
0.000 | 0.000
0.795 | 0.859
0.000 | 0.000
0.000 | 0.000
0.000 | 0.000
0.127 | 0.159
0.000 | 0.000
2peptides
spectra
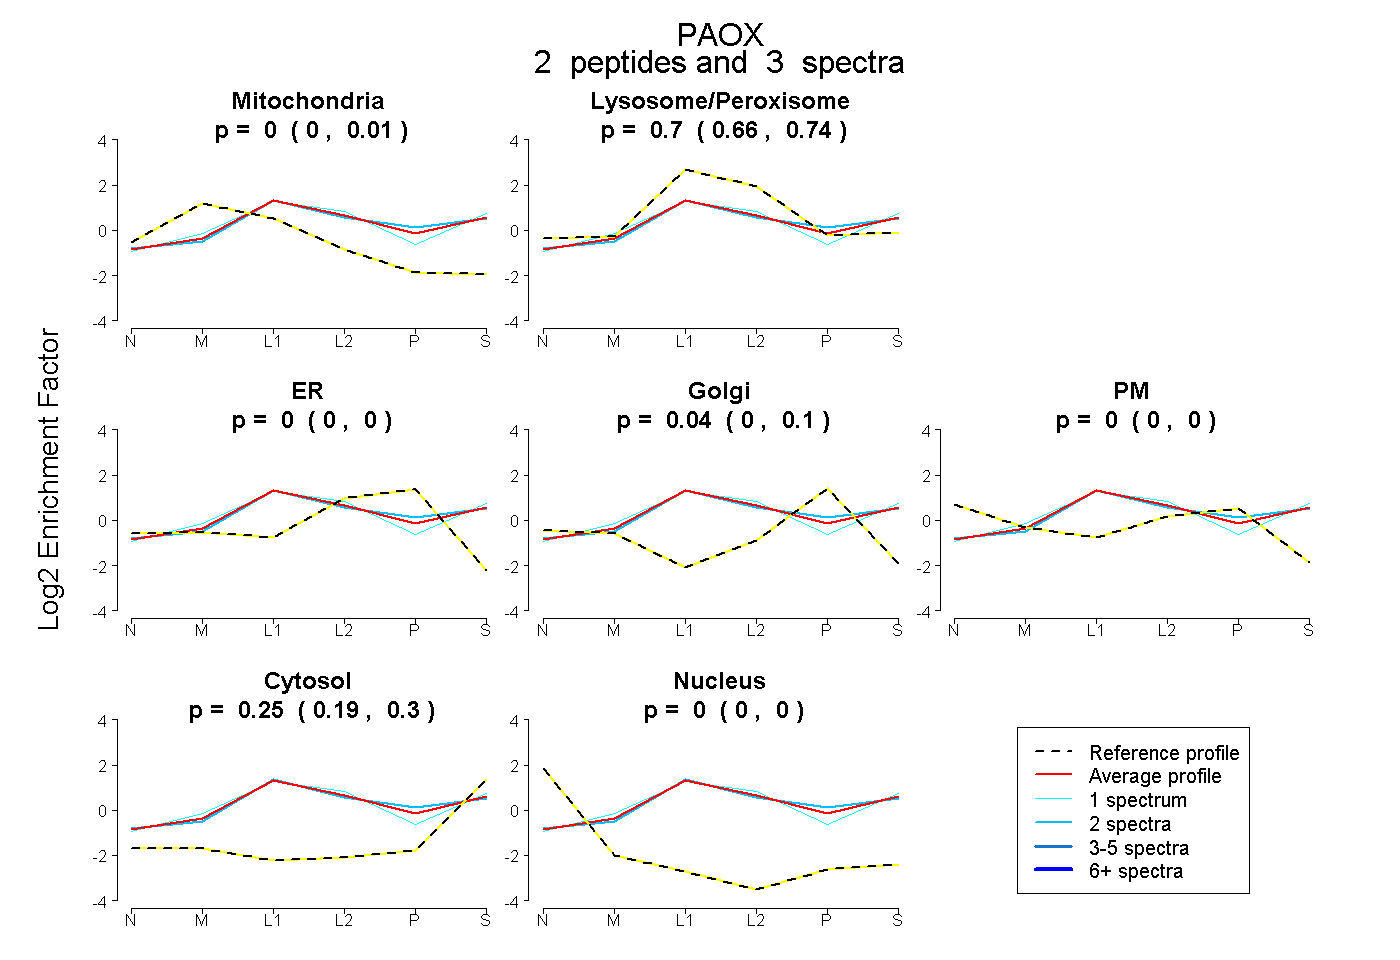
0.000 | 0.012
0.662 | 0.736
0.000 | 0.000
0.000 | 0.103
0.000 | 0.000
0.194 | 0.301
0.000 | 0.000
6peptides
spectra
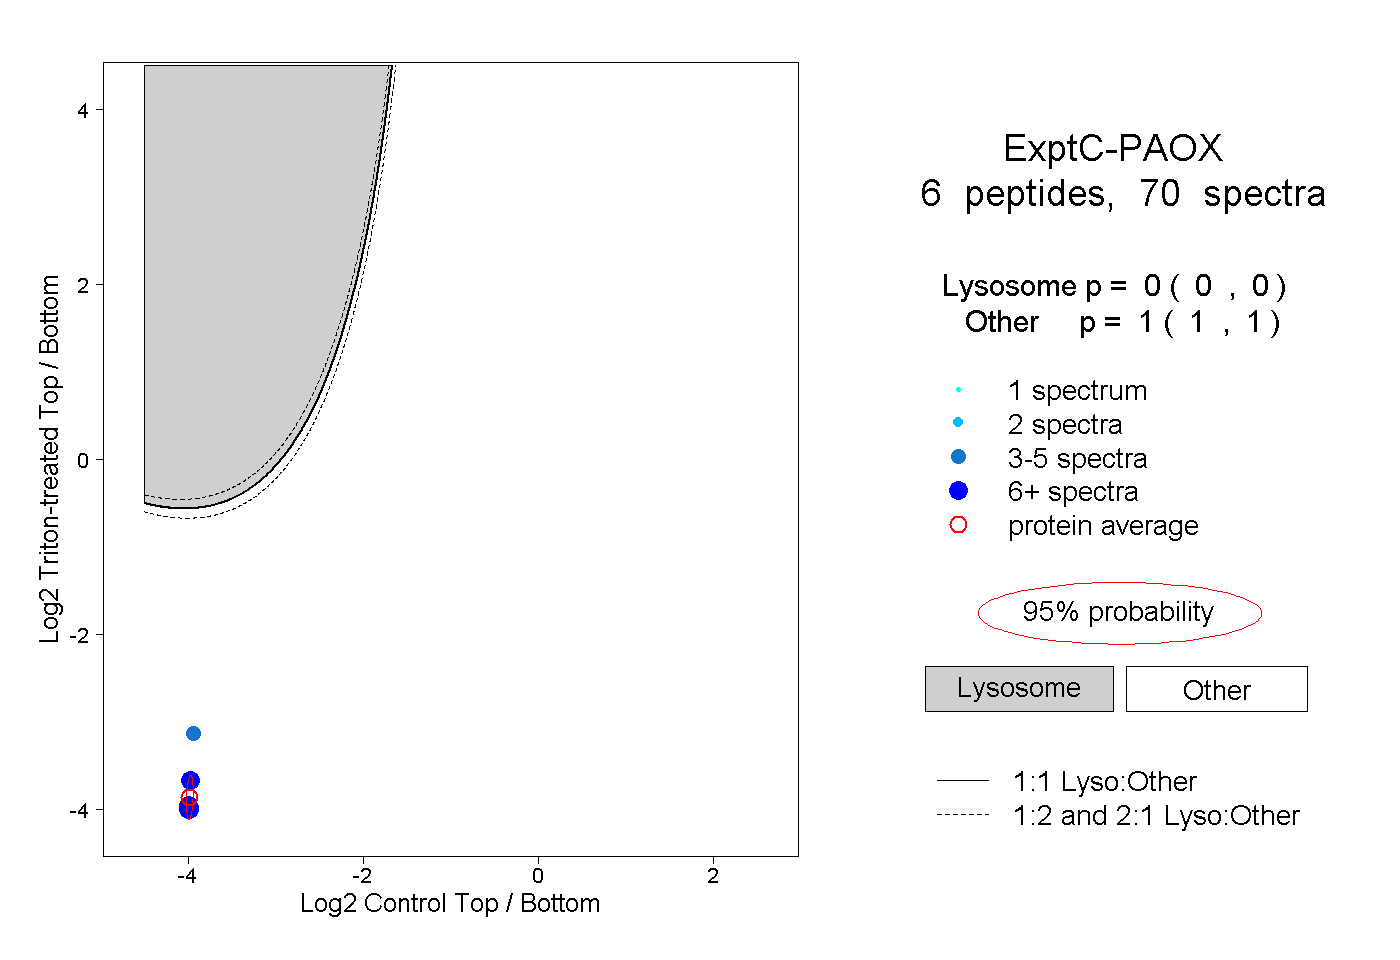
0.000 | 0.000
1.000 | 1.000