 5
5peptides
spectra
0.000 | 0.054
0.000 | 0.000
0.795 | 0.859
0.000 | 0.000
0.000 | 0.000
0.000 | 0.000
0.127 | 0.159
0.000 | 0.000
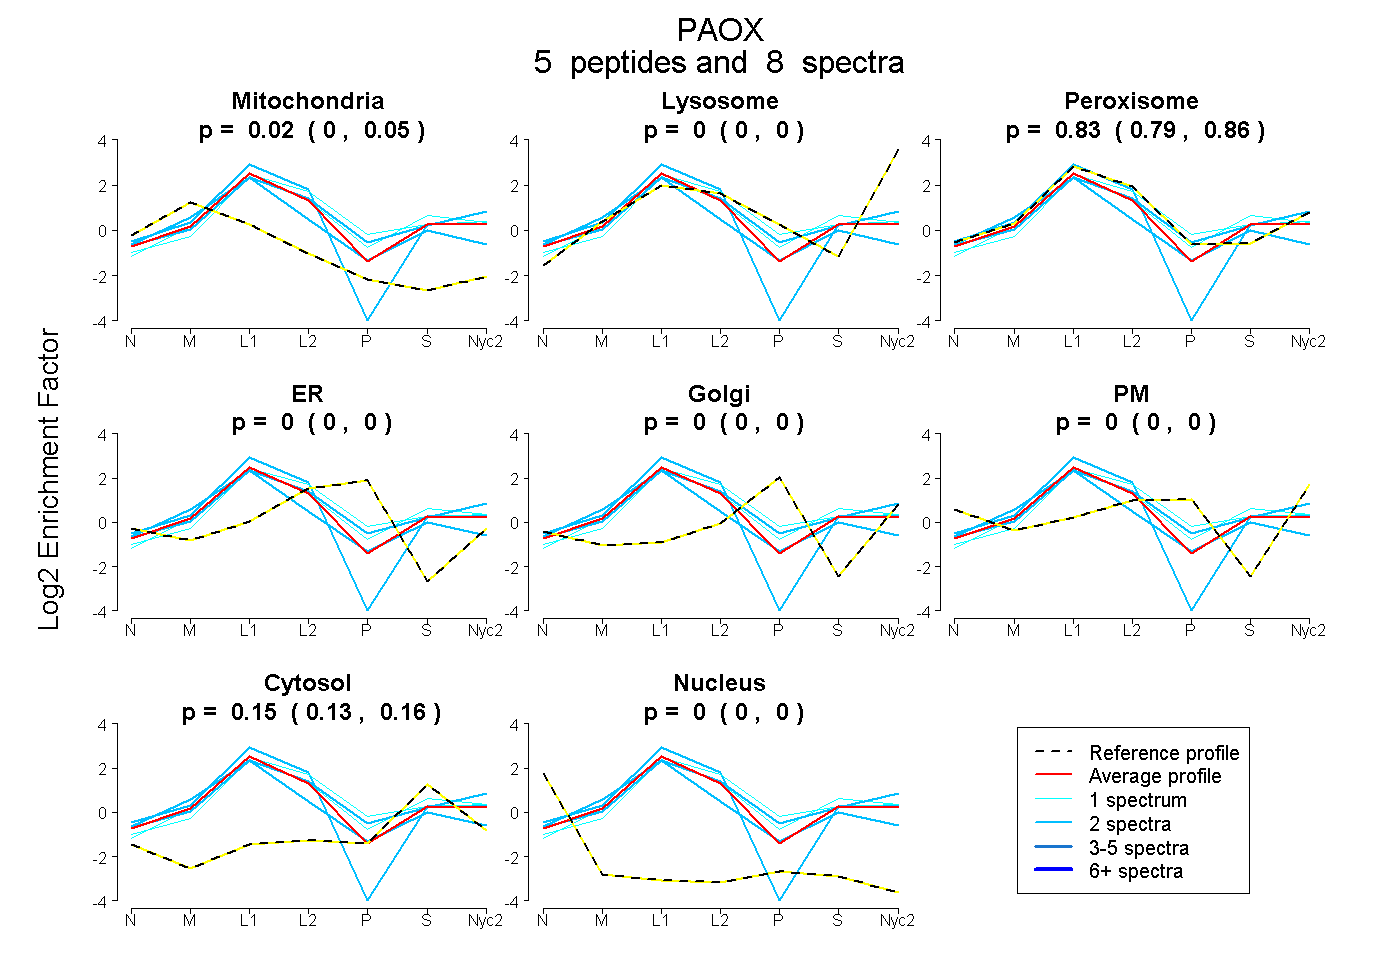
| Plot | Mito | Lyso | Perox | ER | Golgi | PM | Cytosol | Nucleus | |||||
| Expt A |
5 peptides |
8 spectra |
|
0.024 0.000 | 0.054 |
0.000 0.000 | 0.000 |
0.831 0.795 | 0.859 |
0.000 0.000 | 0.000 |
0.000 0.000 | 0.000 |
0.000 0.000 | 0.000 |
0.146 0.127 | 0.159 |
0.000 0.000 | 0.000 |
| 2 spectra, EHQDTFFEPPLPAK | 0.136 | 0.000 | 0.815 | 0.000 | 0.000 | 0.000 | 0.049 | 0.000 | ||
| 1 spectrum, LIGLWDSQAEQSRPR | 0.000 | 0.000 | 0.885 | 0.000 | 0.000 | 0.000 | 0.115 | 0.000 | ||
| 2 spectra, VTGNPQLPAAK | 0.000 | 0.053 | 0.809 | 0.000 | 0.000 | 0.000 | 0.138 | 0.000 | ||
| 2 spectra, TFYSTTHGALLSGWR | 0.235 | 0.000 | 0.644 | 0.000 | 0.000 | 0.000 | 0.121 | 0.000 | ||
| 1 spectrum, LGFGTNNK | 0.000 | 0.000 | 0.797 | 0.000 | 0.000 | 0.000 | 0.203 | 0.000 |
| Plot | Mito | Lyso or Perox | ER | Golgi | PM | Cytosol | Nucleus | ||||||
| Expt B |
2 peptides |
3 spectra |
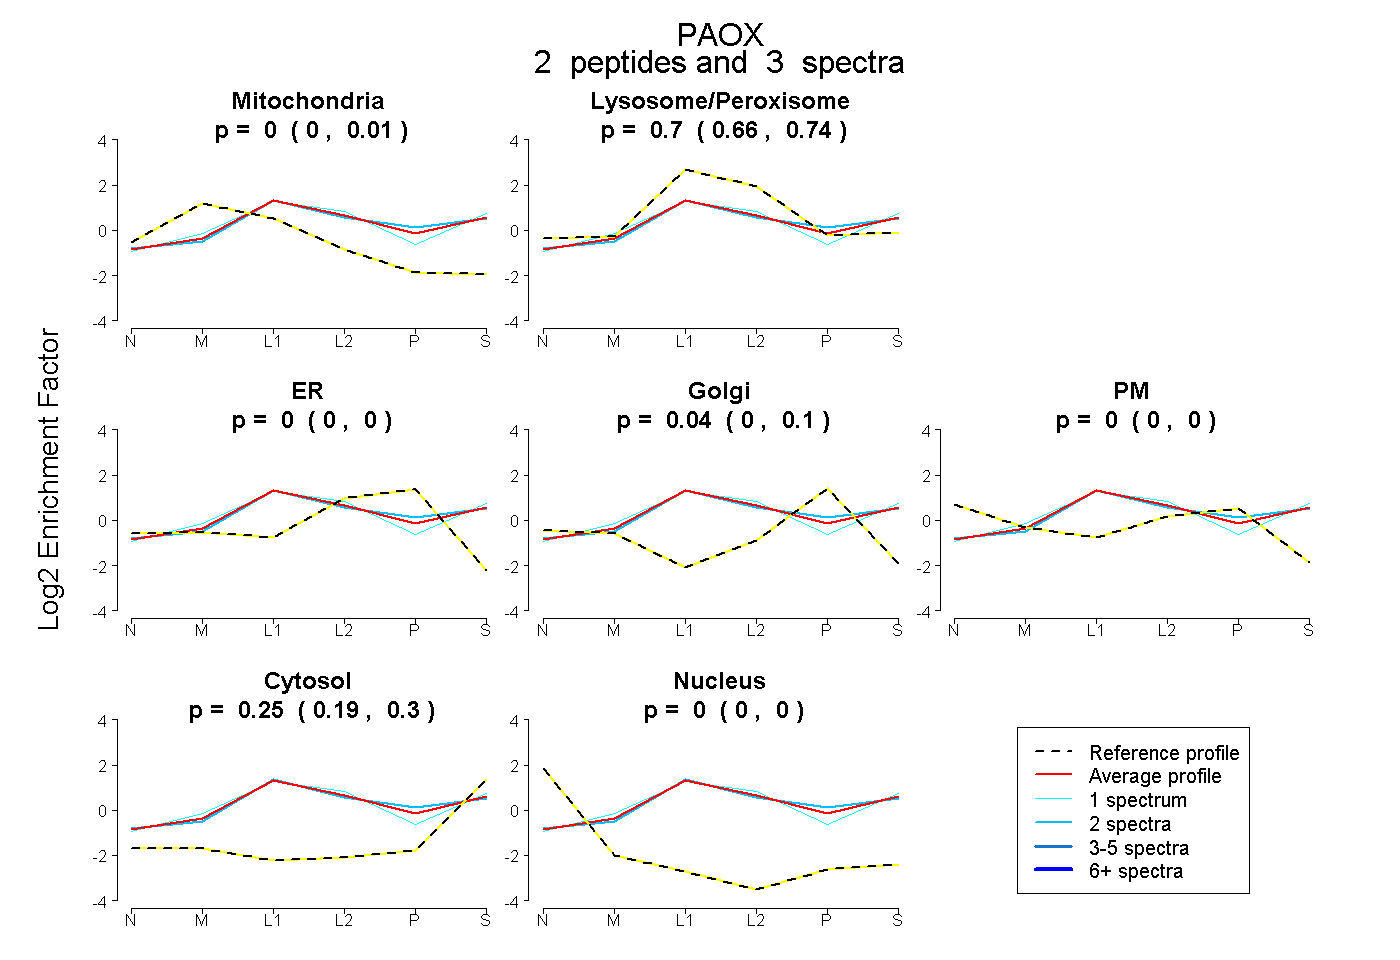 |
0.000 0.000 | 0.012 |
0.704 0.662 | 0.736 |
0.000 0.000 | 0.000 |
0.041 0.000 | 0.103 |
0.000 0.000 | 0.000 |
0.255 0.194 | 0.301 |
0.000 0.000 | 0.000 |
|||
| Plot | Lyso | Other | |||||||||||
| Expt C |
6 peptides |
70 spectra |
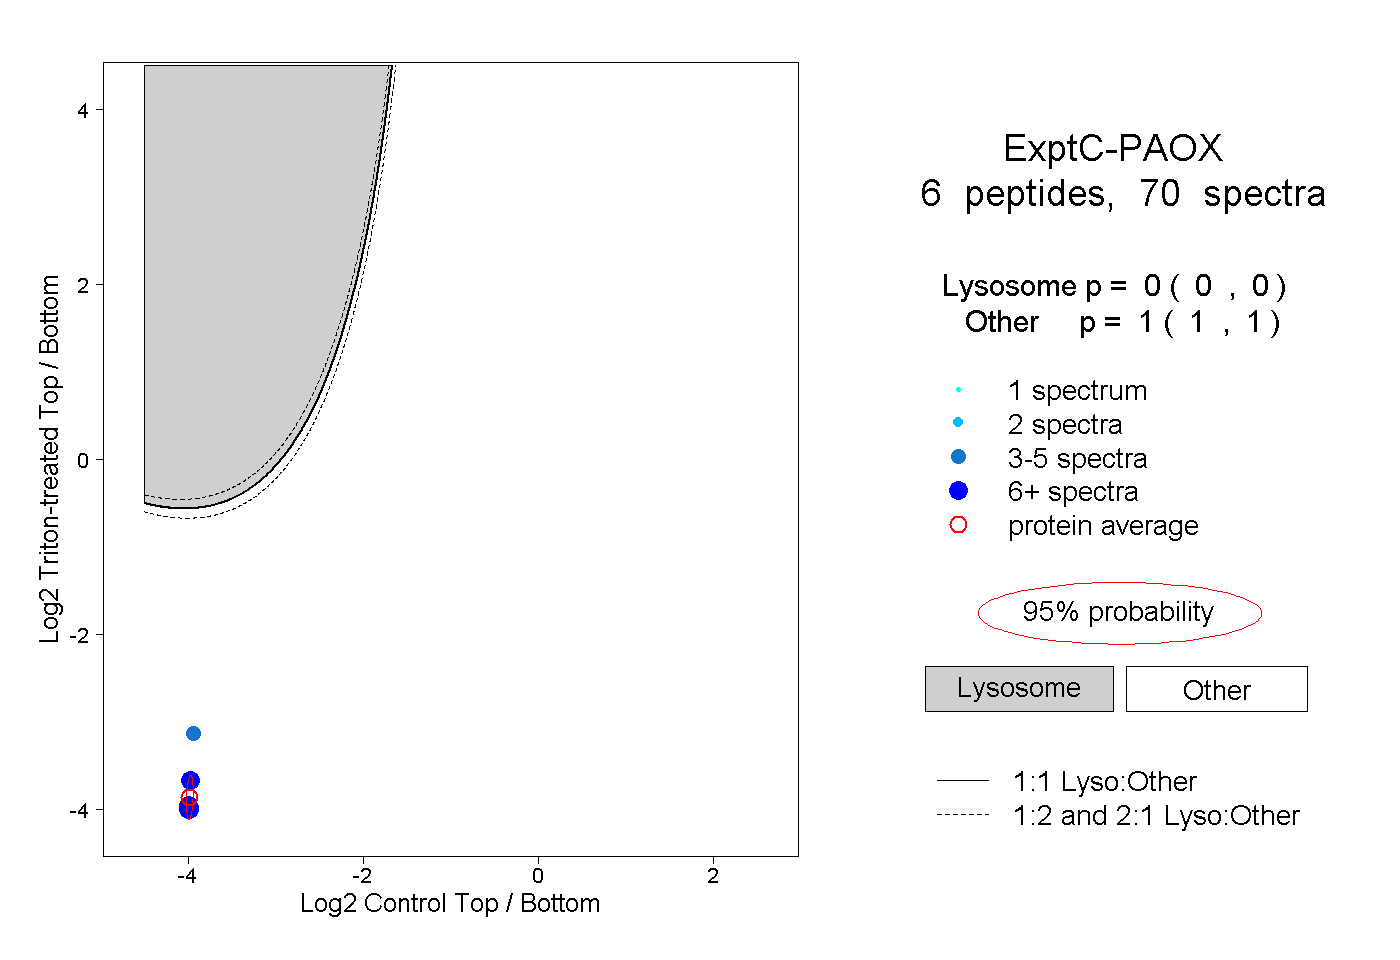 |
0.000 0.000 | 0.000 |
1.000 1.000 | 1.000 |