 10
10peptides
spectra
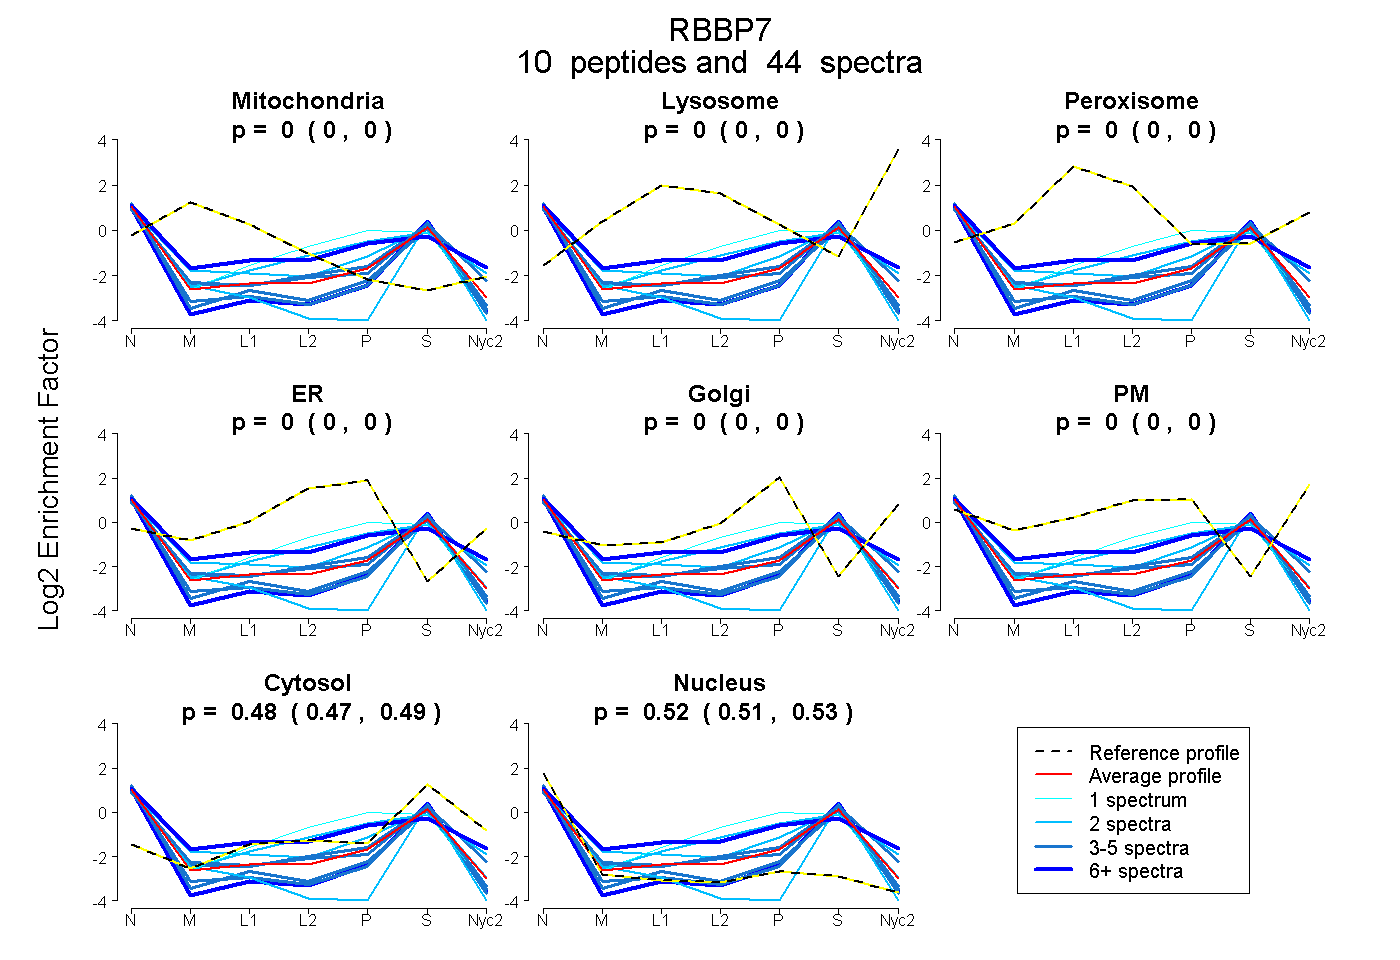
0.000 | 0.000
0.000 | 0.000
0.000 | 0.000
0.000 | 0.000
0.000 | 0.000
0.000 | 0.000
0.472 | 0.488
0.511 | 0.527
2peptides
spectra
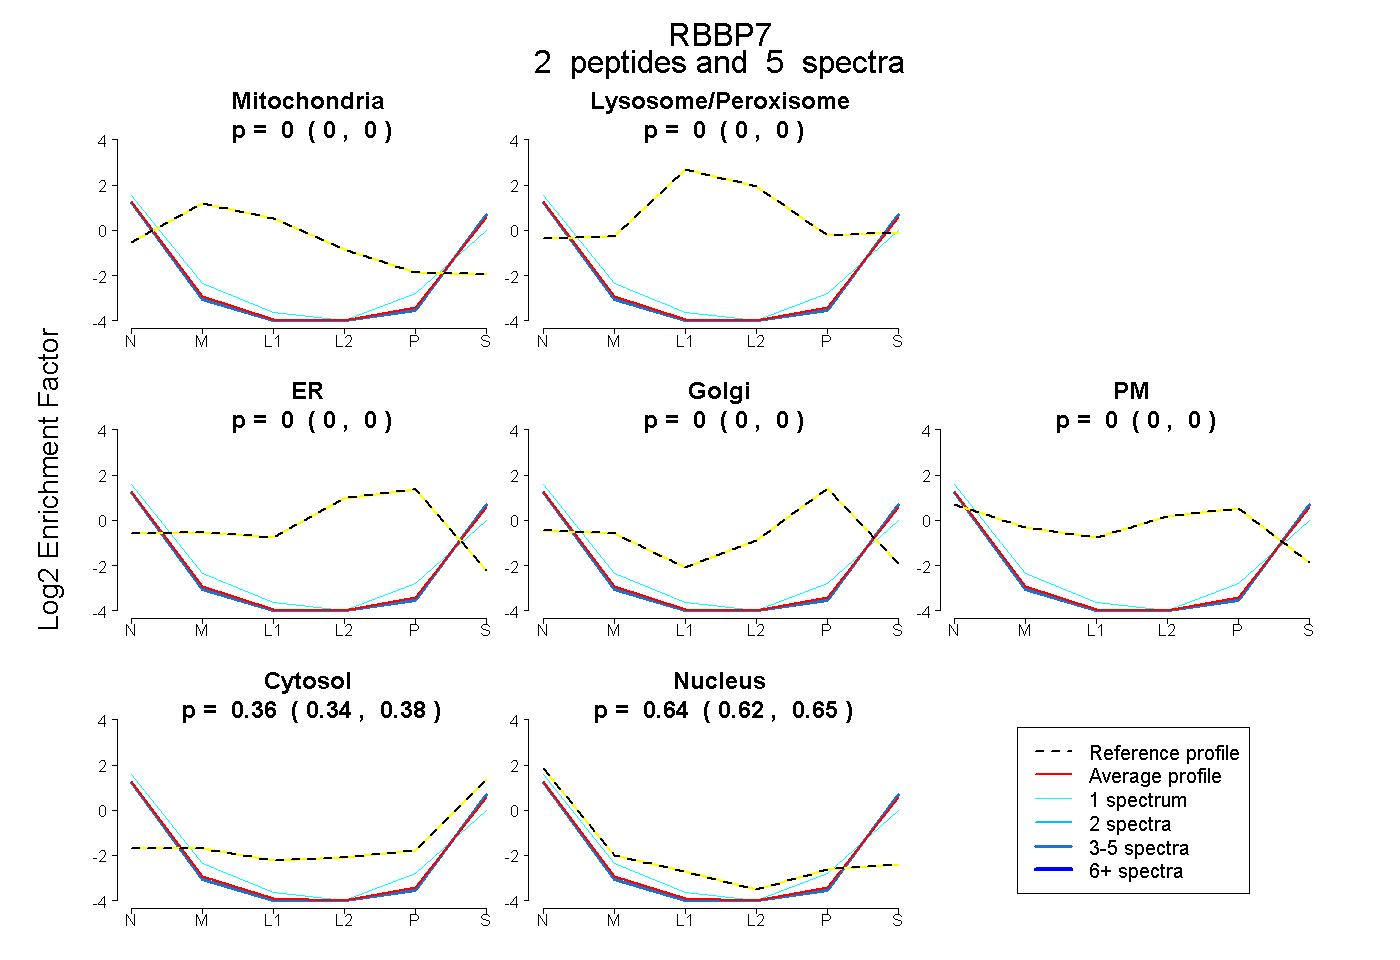
0.000 | 0.000
0.000 | 0.000
0.000 | 0.000
0.000 | 0.000
0.000 | 0.000
0.343 | 0.378
0.620 | 0.653
3peptides
spectra
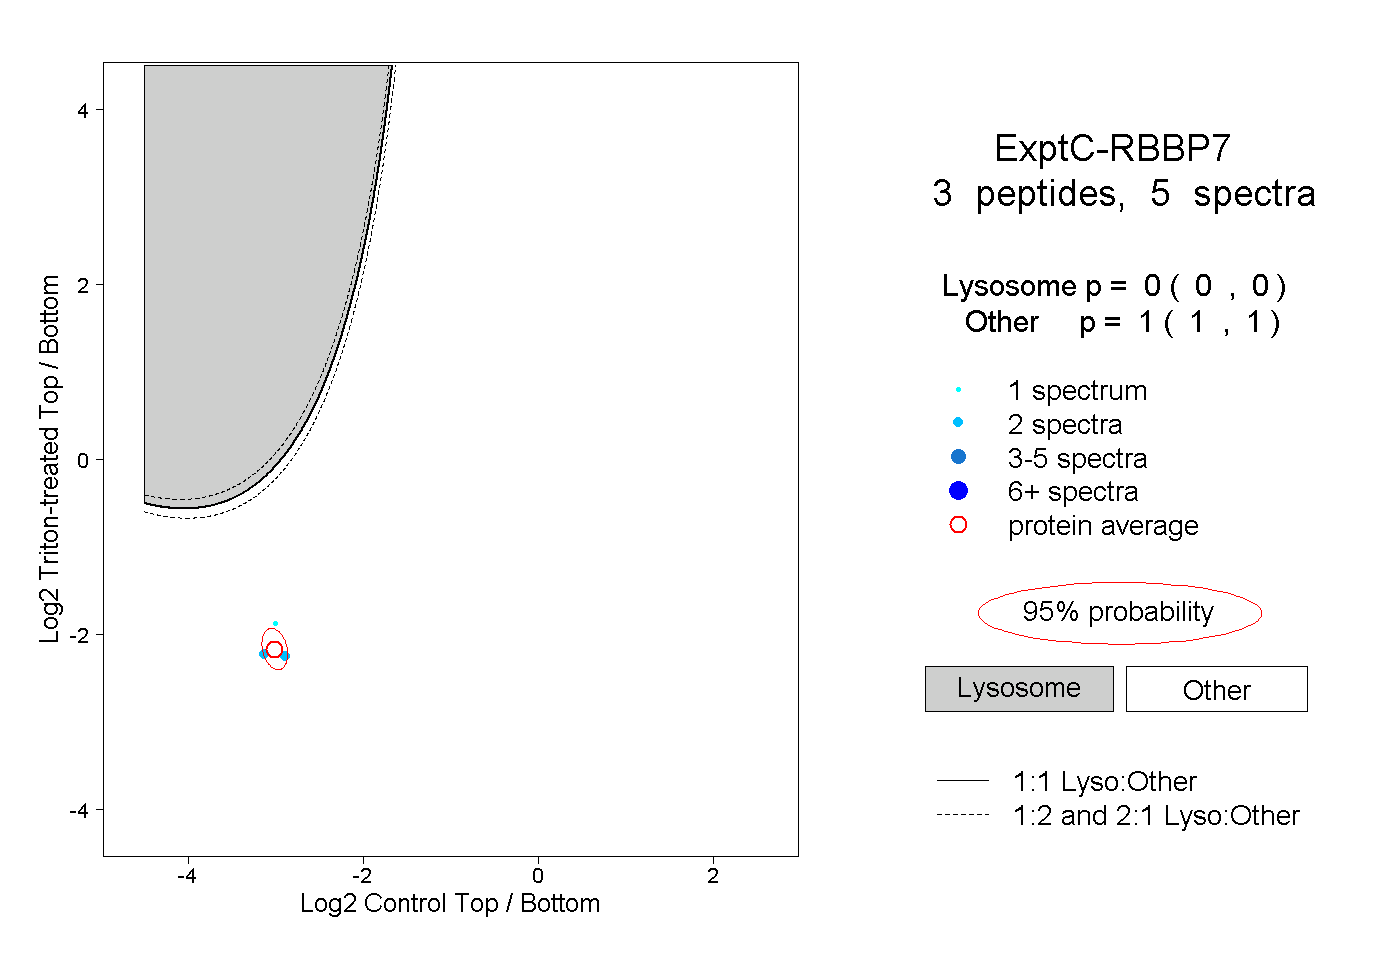
0.000 | 0.000
1.000 | 1.000