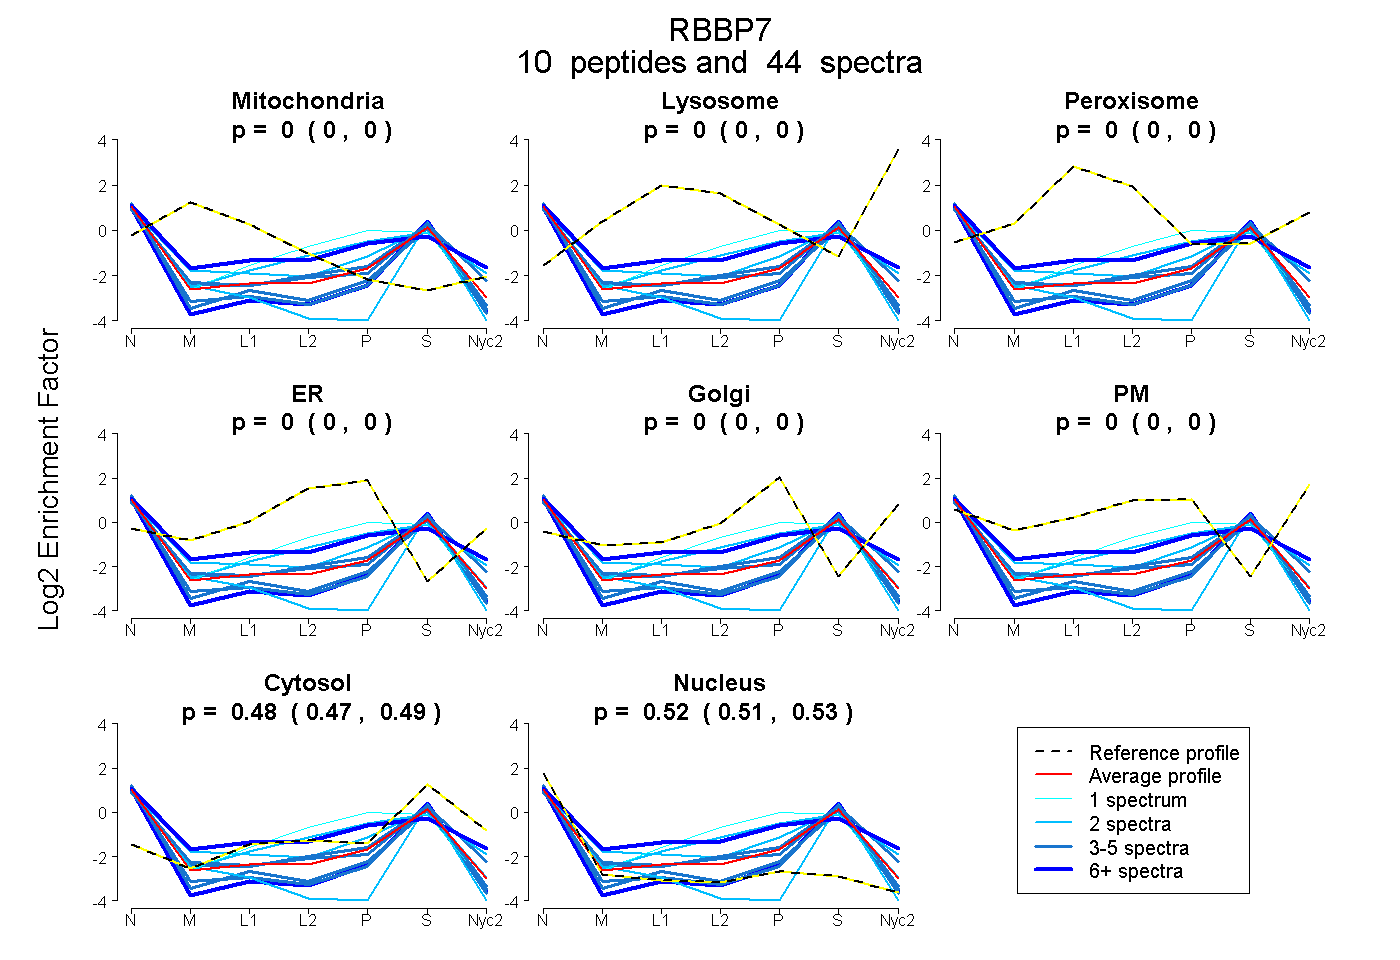
 10
10peptides
spectra
0.000 | 0.000
0.000 | 0.000
0.000 | 0.000
0.000 | 0.000
0.000 | 0.000
0.000 | 0.000
0.472 | 0.488
0.511 | 0.527
| Plot | Mito | Lyso | Perox | ER | Golgi | PM | Cytosol | Nucleus | |||||
| Expt A |
10 peptides |
44 spectra |
|
0.000 0.000 | 0.000 |
0.000 0.000 | 0.000 |
0.000 0.000 | 0.000 |
0.000 0.000 | 0.000 |
0.000 0.000 | 0.000 |
0.000 0.000 | 0.000 |
0.480 0.472 | 0.488 |
0.520 0.511 | 0.527 |
| 3 spectra, INHEGEVNR | 0.000 | 0.000 | 0.000 | 0.000 | 0.000 | 0.000 | 0.364 | 0.636 | ||
| 4 spectra, IECEIK | 0.000 | 0.000 | 0.000 | 0.000 | 0.000 | 0.000 | 0.365 | 0.635 | ||
| 4 spectra, YMPQNPHIIATK | 0.000 | 0.000 | 0.000 | 0.000 | 0.000 | 0.000 | 0.487 | 0.513 | ||
| 9 spectra, VINEEYK | 0.000 | 0.000 | 0.067 | 0.058 | 0.000 | 0.151 | 0.374 | 0.350 | ||
| 2 spectra, HPAKPDPSGECNPDLR | 0.050 | 0.000 | 0.008 | 0.031 | 0.000 | 0.000 | 0.472 | 0.440 | ||
| 2 spectra, TVALWDLR | 0.000 | 0.000 | 0.000 | 0.205 | 0.000 | 0.000 | 0.458 | 0.337 | ||
| 2 spectra, TPSSDVLVFDYTK | 0.000 | 0.000 | 0.000 | 0.000 | 0.000 | 0.000 | 0.274 | 0.726 | ||
| 4 spectra, LMIWDTR | 0.000 | 0.000 | 0.000 | 0.000 | 0.000 | 0.000 | 0.563 | 0.437 | ||
| 13 spectra, EMFEDTVEER | 0.000 | 0.000 | 0.000 | 0.000 | 0.000 | 0.000 | 0.368 | 0.632 | ||
| 1 spectrum, VHIPNDDAQFDASHCDSDK | 0.000 | 0.000 | 0.000 | 0.252 | 0.000 | 0.000 | 0.371 | 0.377 |
| Plot | Mito | Lyso or Perox | ER | Golgi | PM | Cytosol | Nucleus | ||||||
| Expt B |
2 peptides |
5 spectra |
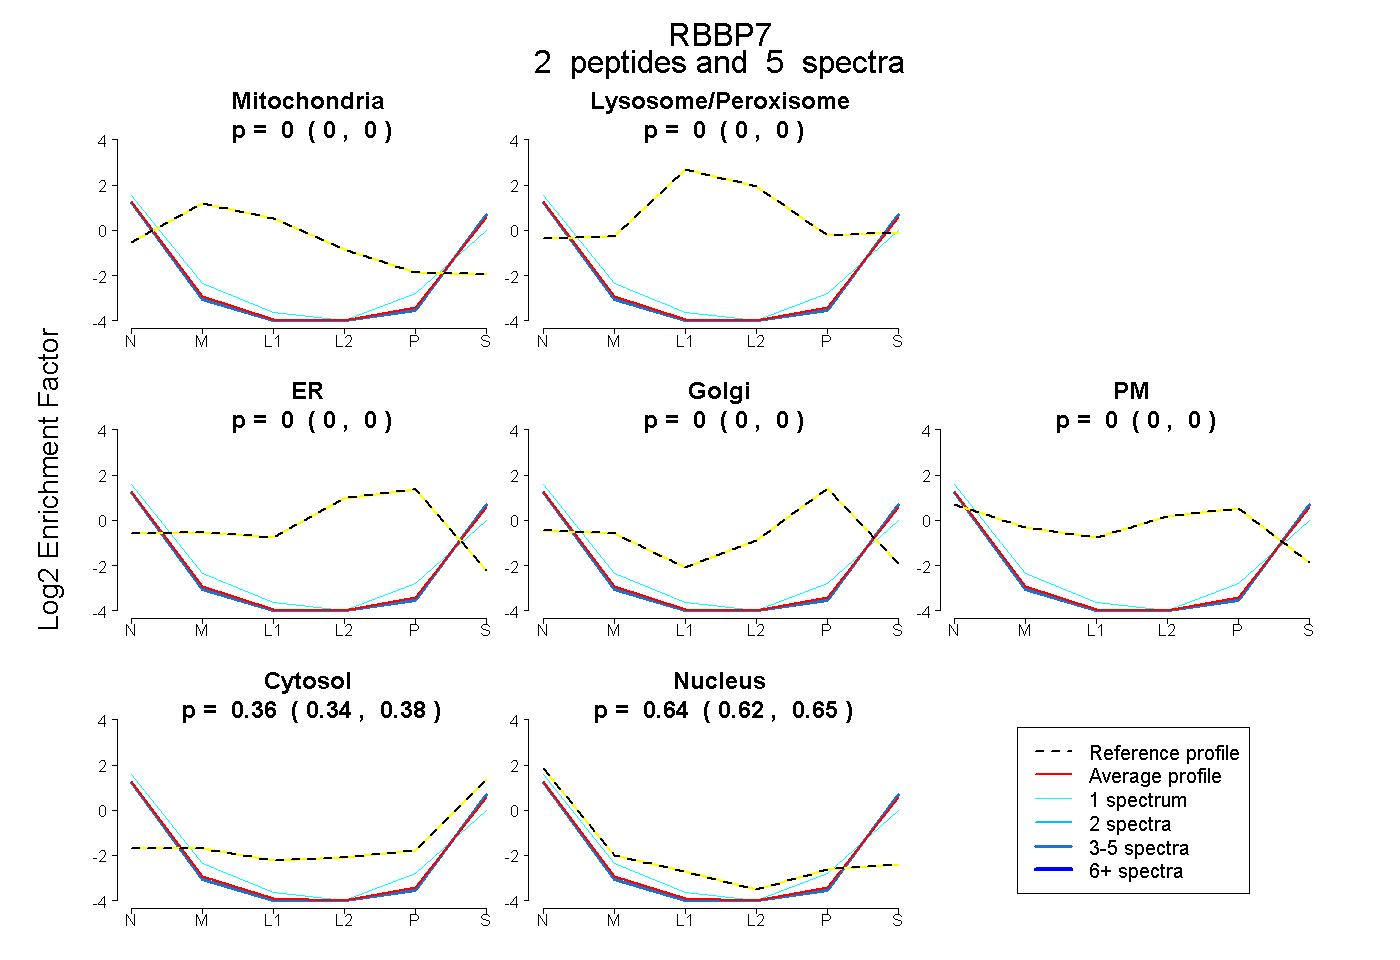 |
0.000 0.000 | 0.000 |
0.000 0.000 | 0.000 |
0.000 0.000 | 0.000 |
0.000 0.000 | 0.000 |
0.000 0.000 | 0.000 |
0.362 0.343 | 0.378 |
0.638 0.620 | 0.653 |
|||
| Plot | Lyso | Other | |||||||||||
| Expt C |
3 peptides |
5 spectra |
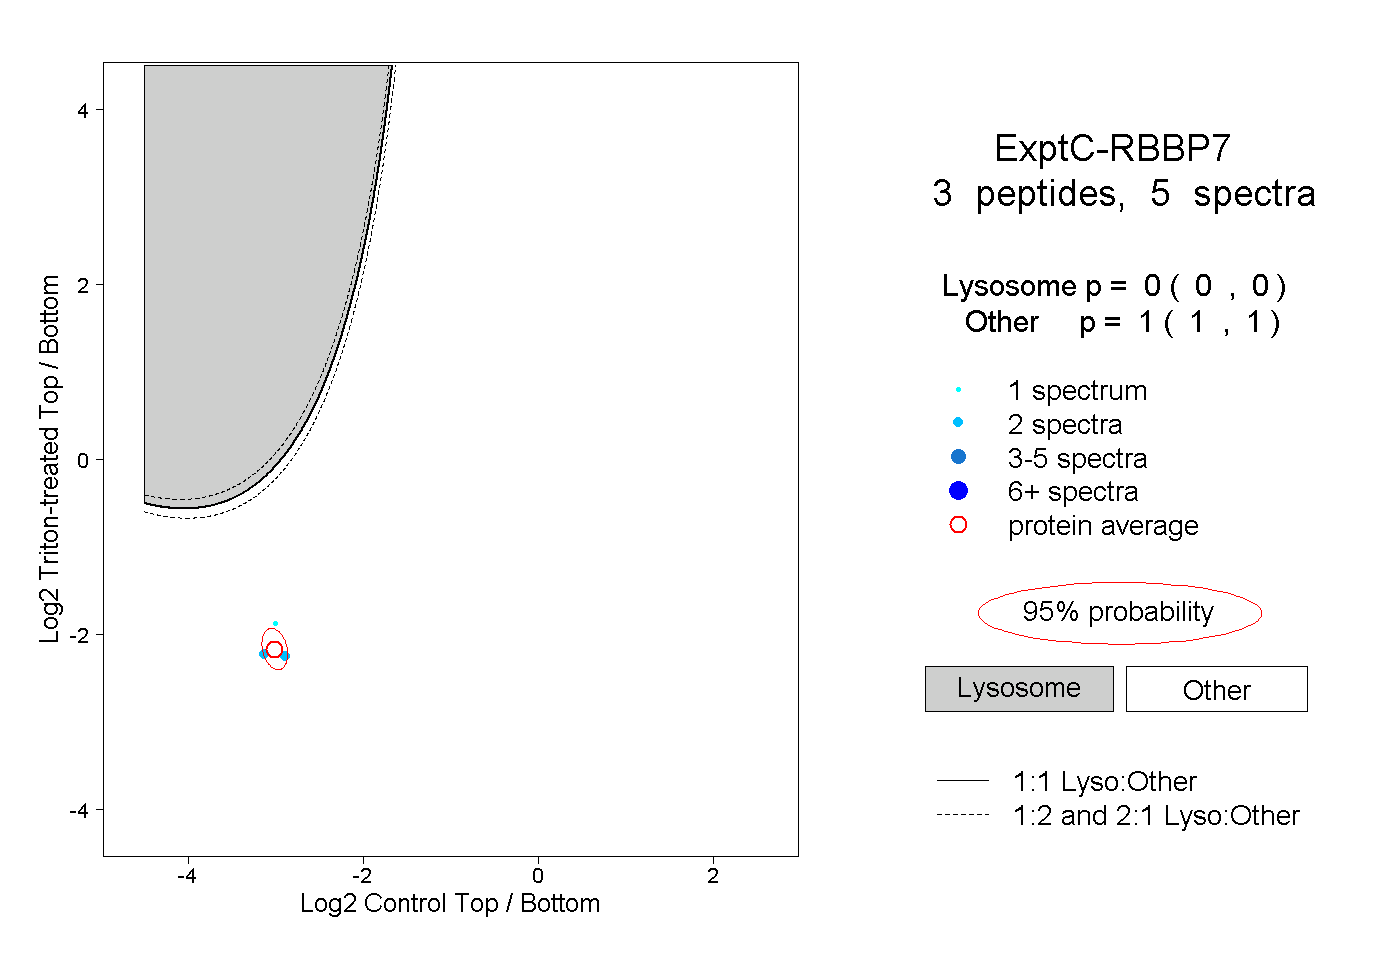 |
0.000 0.000 | 0.000 |
1.000 1.000 | 1.000 |