 6
6peptides
spectra
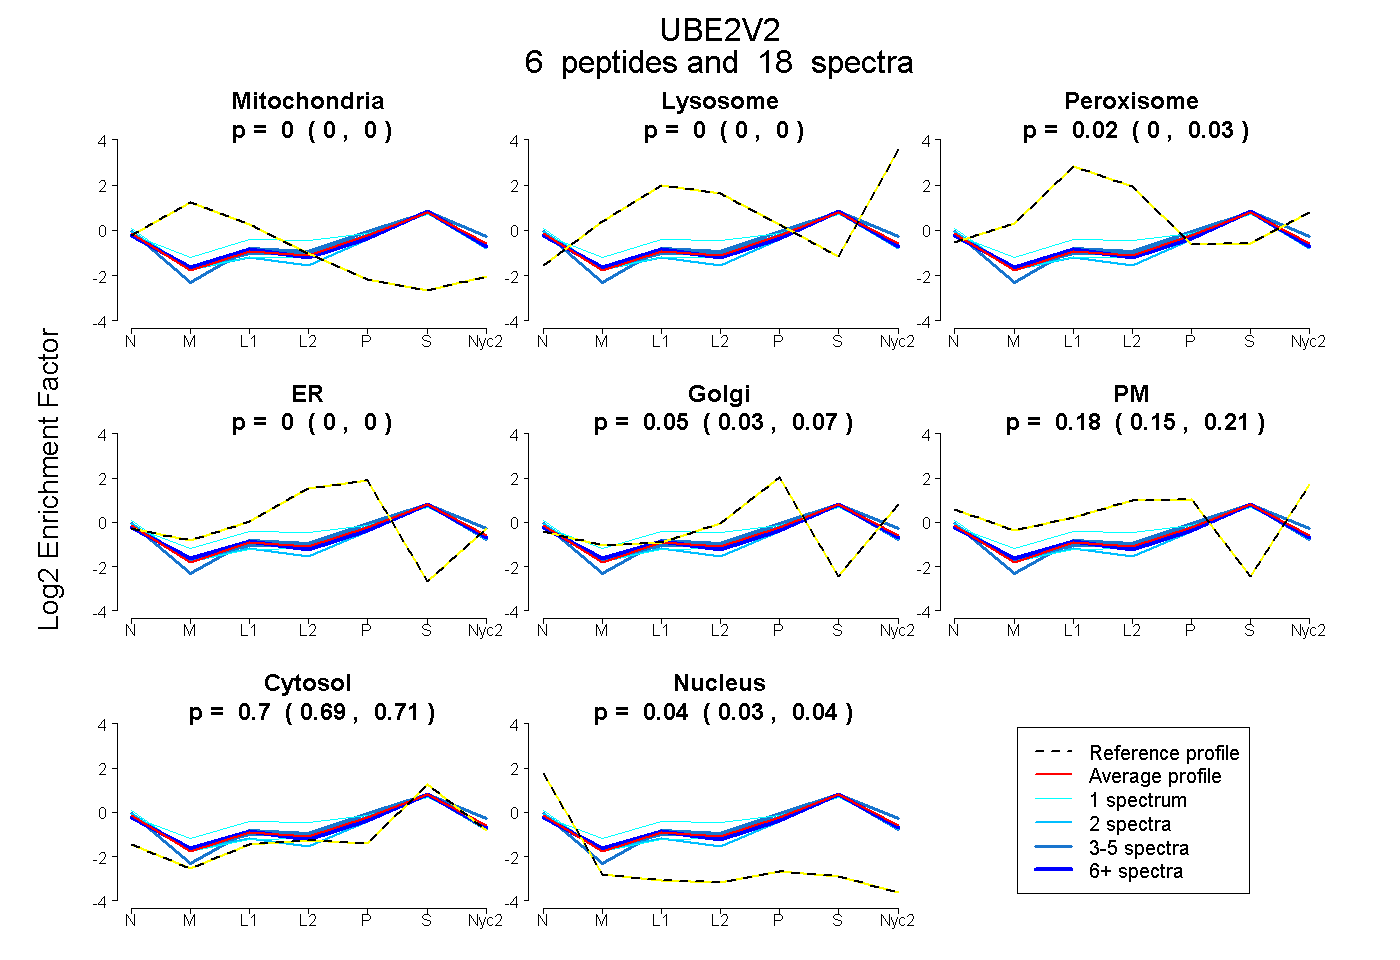
0.000 | 0.000
0.000 | 0.000
0.002 | 0.034
0.000 | 0.000
0.032 | 0.075
0.150 | 0.209
0.692 | 0.714
0.031 | 0.044
7peptides
spectra
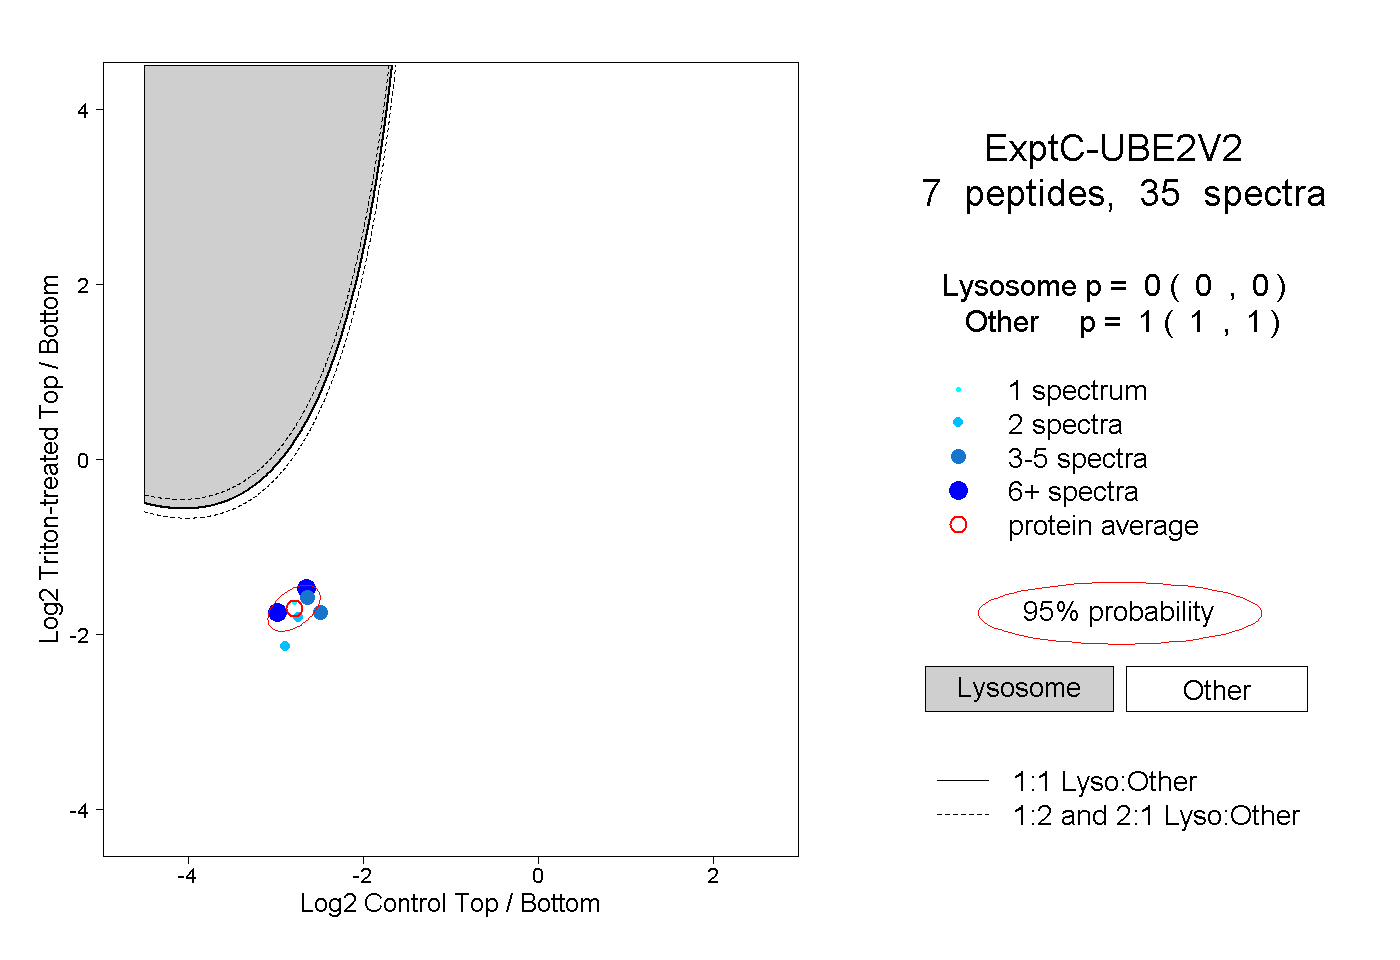
0.000 | 0.000
1.000 | 1.000
3peptides
spectra
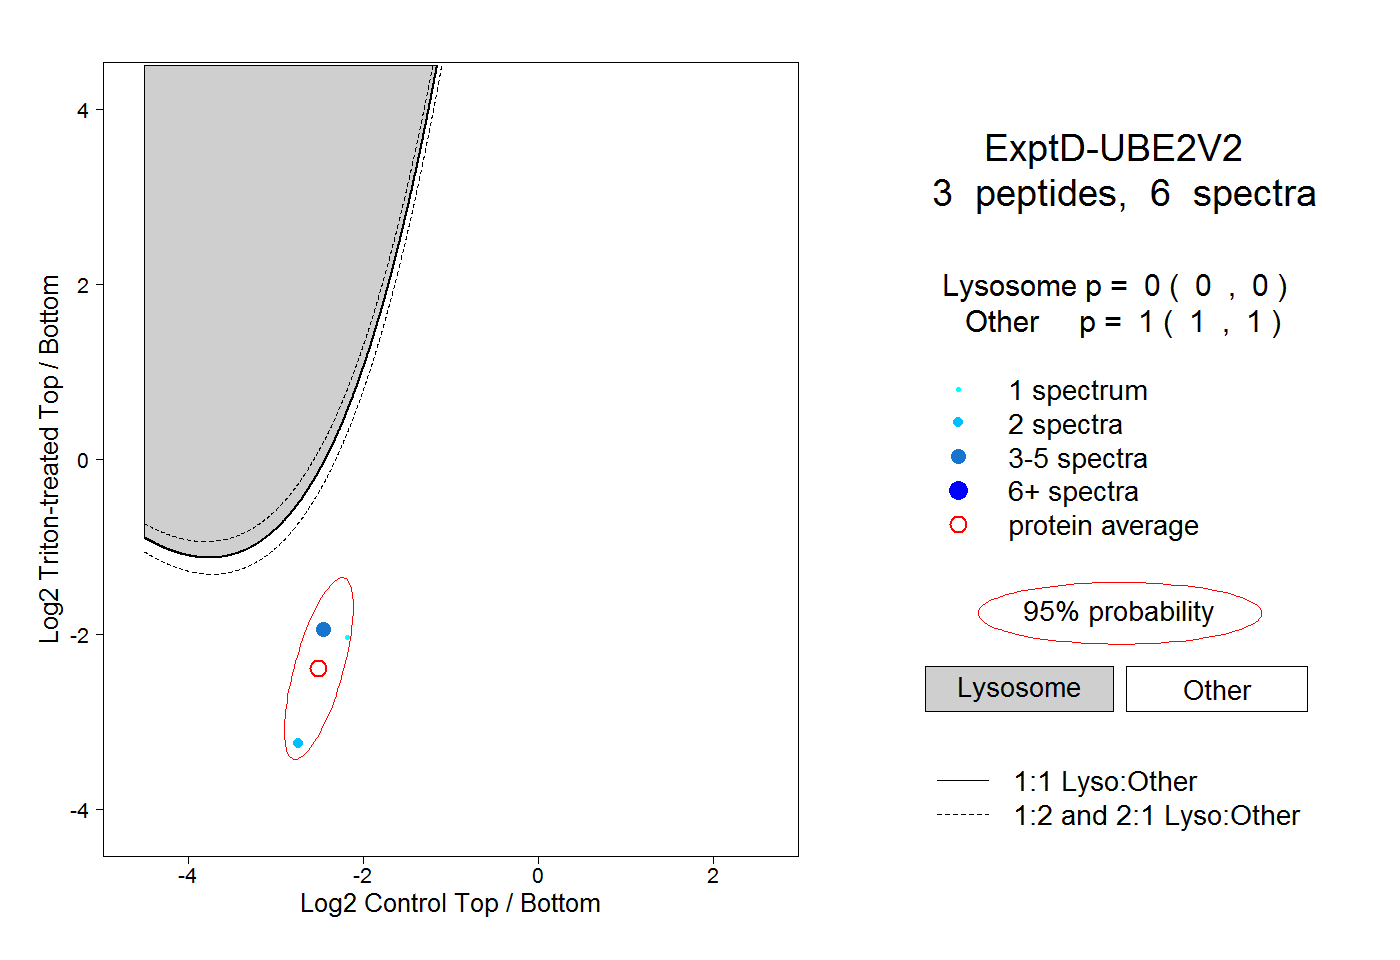
0.000 | 0.000
1.000 | 1.000