 6
6peptides
spectra
0.000 | 0.000
0.000 | 0.000
0.002 | 0.034
0.000 | 0.000
0.032 | 0.075
0.150 | 0.209
0.692 | 0.714
0.031 | 0.044
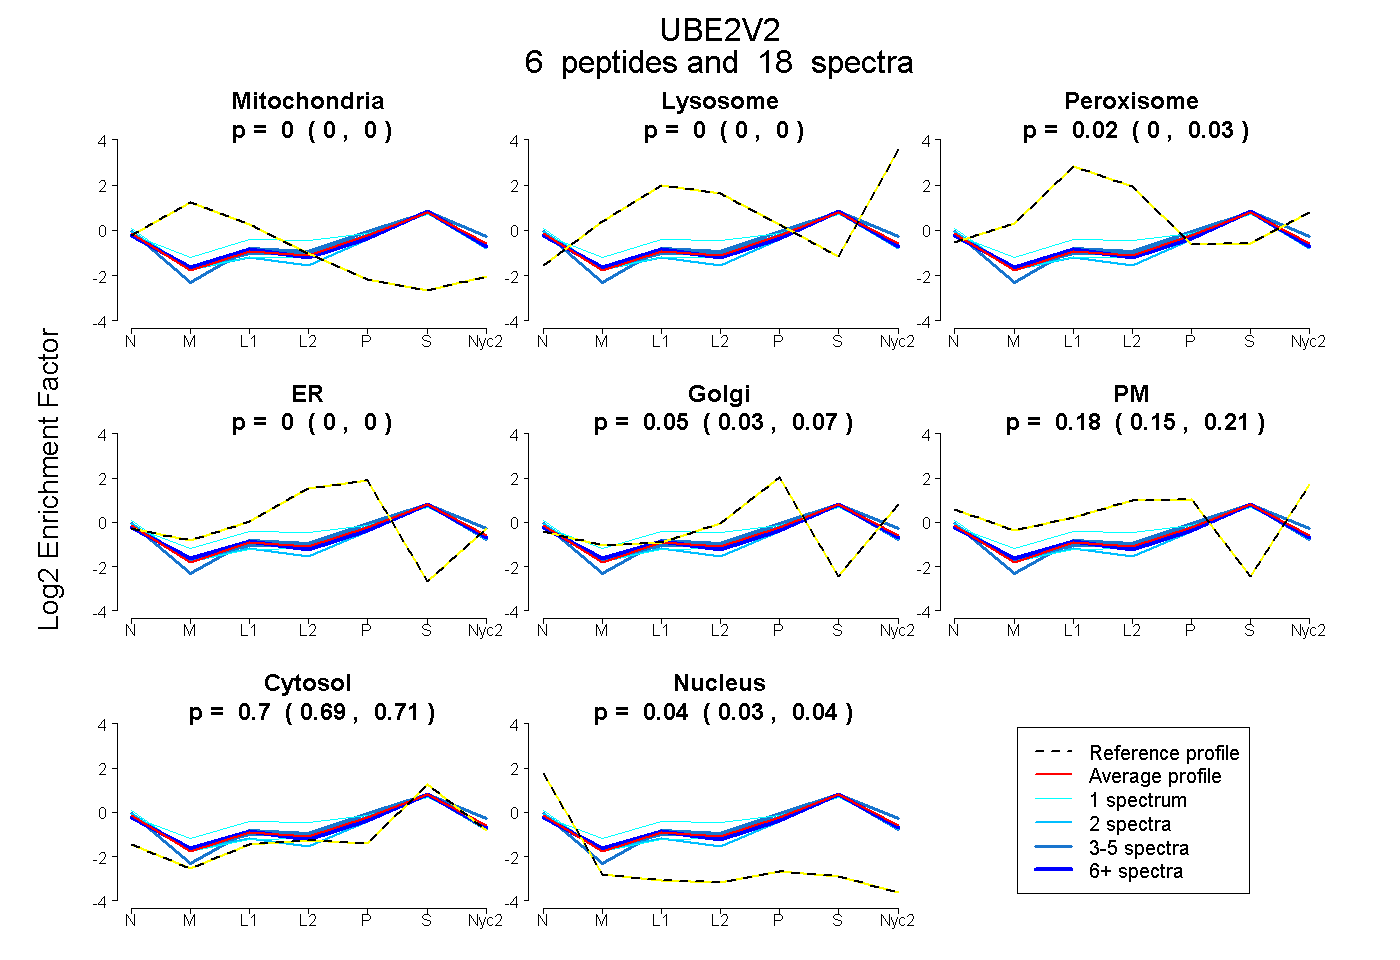
| Plot | Mito | Lyso | Perox | ER | Golgi | PM | Cytosol | Nucleus | |||||
| Expt A |
6 peptides |
18 spectra |
|
0.000 0.000 | 0.000 |
0.000 0.000 | 0.000 |
0.019 0.002 | 0.034 |
0.000 0.000 | 0.000 |
0.055 0.032 | 0.075 |
0.184 0.150 | 0.209 |
0.704 0.692 | 0.714 |
0.038 0.031 | 0.044 |
| 1 spectrum, WQNSYSIK | 0.000 | 0.000 | 0.000 | 0.000 | 0.070 | 0.214 | 0.671 | 0.045 | ||
| 2 spectra, SIPVLAK | 0.000 | 0.000 | 0.000 | 0.000 | 0.067 | 0.135 | 0.709 | 0.089 | ||
| 4 spectra, LLEELEEGQK | 0.000 | 0.000 | 0.000 | 0.123 | 0.013 | 0.112 | 0.721 | 0.032 | ||
| 6 spectra, YPEAPPSVR | 0.000 | 0.000 | 0.083 | 0.000 | 0.097 | 0.080 | 0.682 | 0.058 | ||
| 4 spectra, WTGMIIGPPR | 0.000 | 0.000 | 0.000 | 0.000 | 0.028 | 0.242 | 0.727 | 0.003 | ||
| 1 spectrum, VECGSK | 0.000 | 0.000 | 0.190 | 0.076 | 0.055 | 0.074 | 0.580 | 0.025 |
| Plot | Lyso | Other | |||||||||||
| Expt C |
7 peptides |
35 spectra |
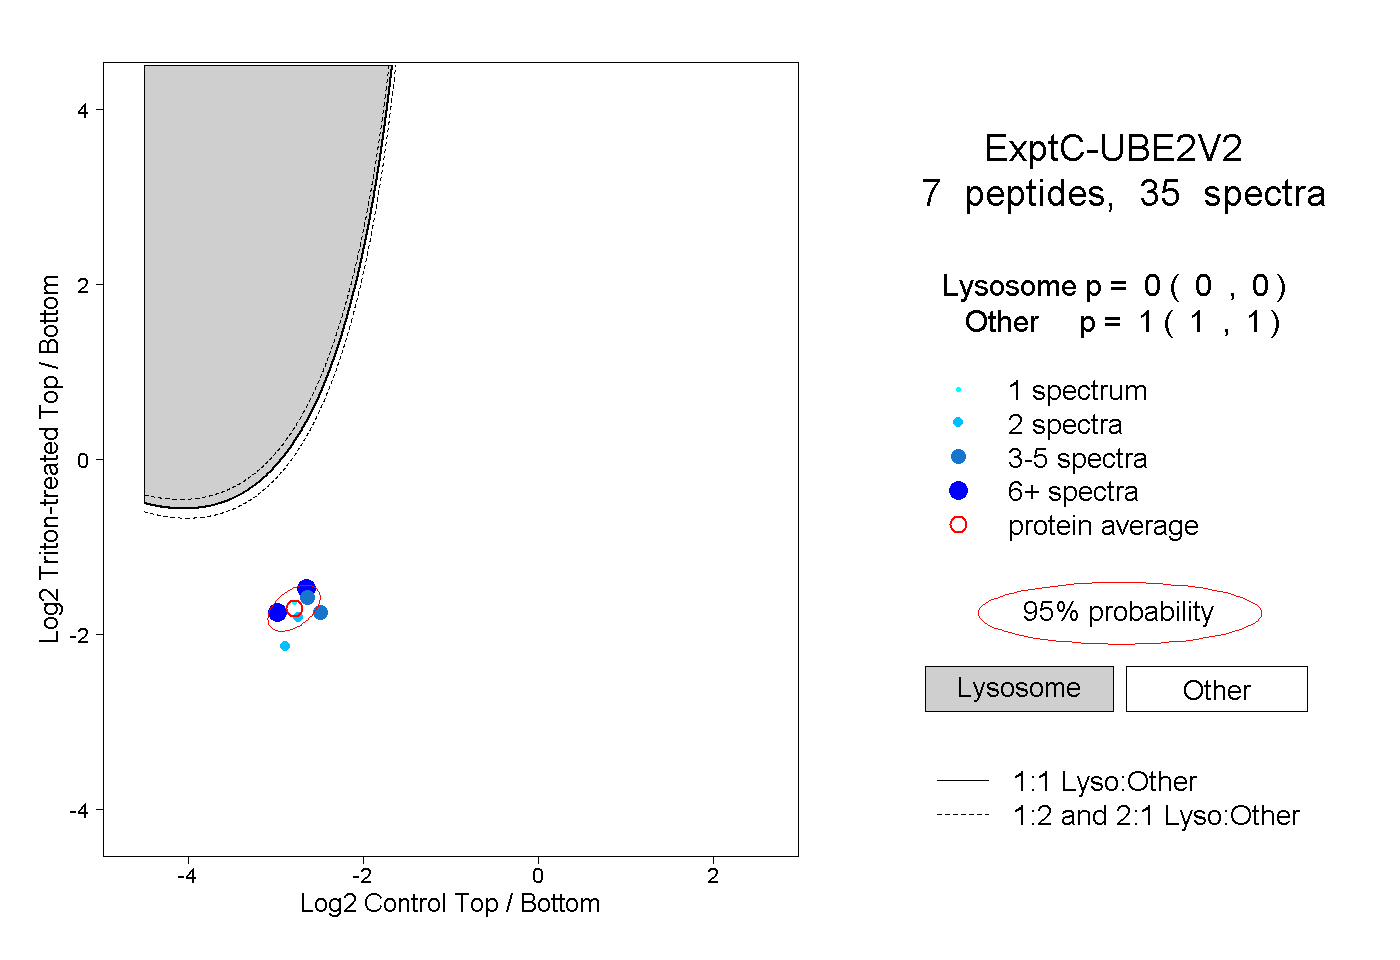 |
0.000 0.000 | 0.000 |
1.000 1.000 | 1.000 |
||||||||
| Plot | Lyso | Other | |||||||||||
| Expt D |
3 peptides |
6 spectra |
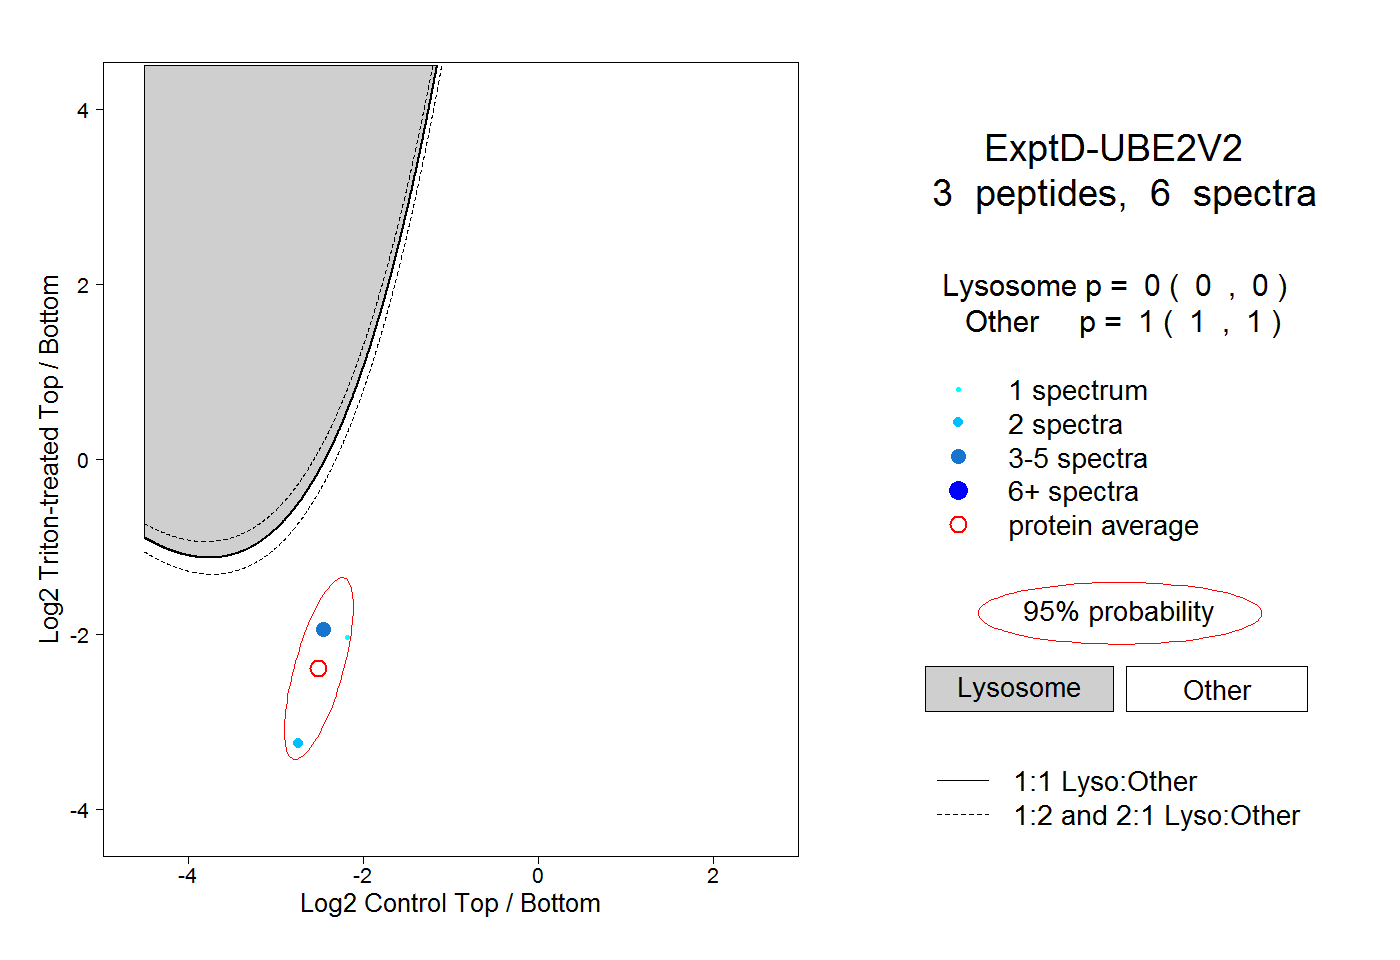 |
0.000 0.000 | 0.000 |
1.000 1.000 | 1.000 |