 6
6peptides
spectra
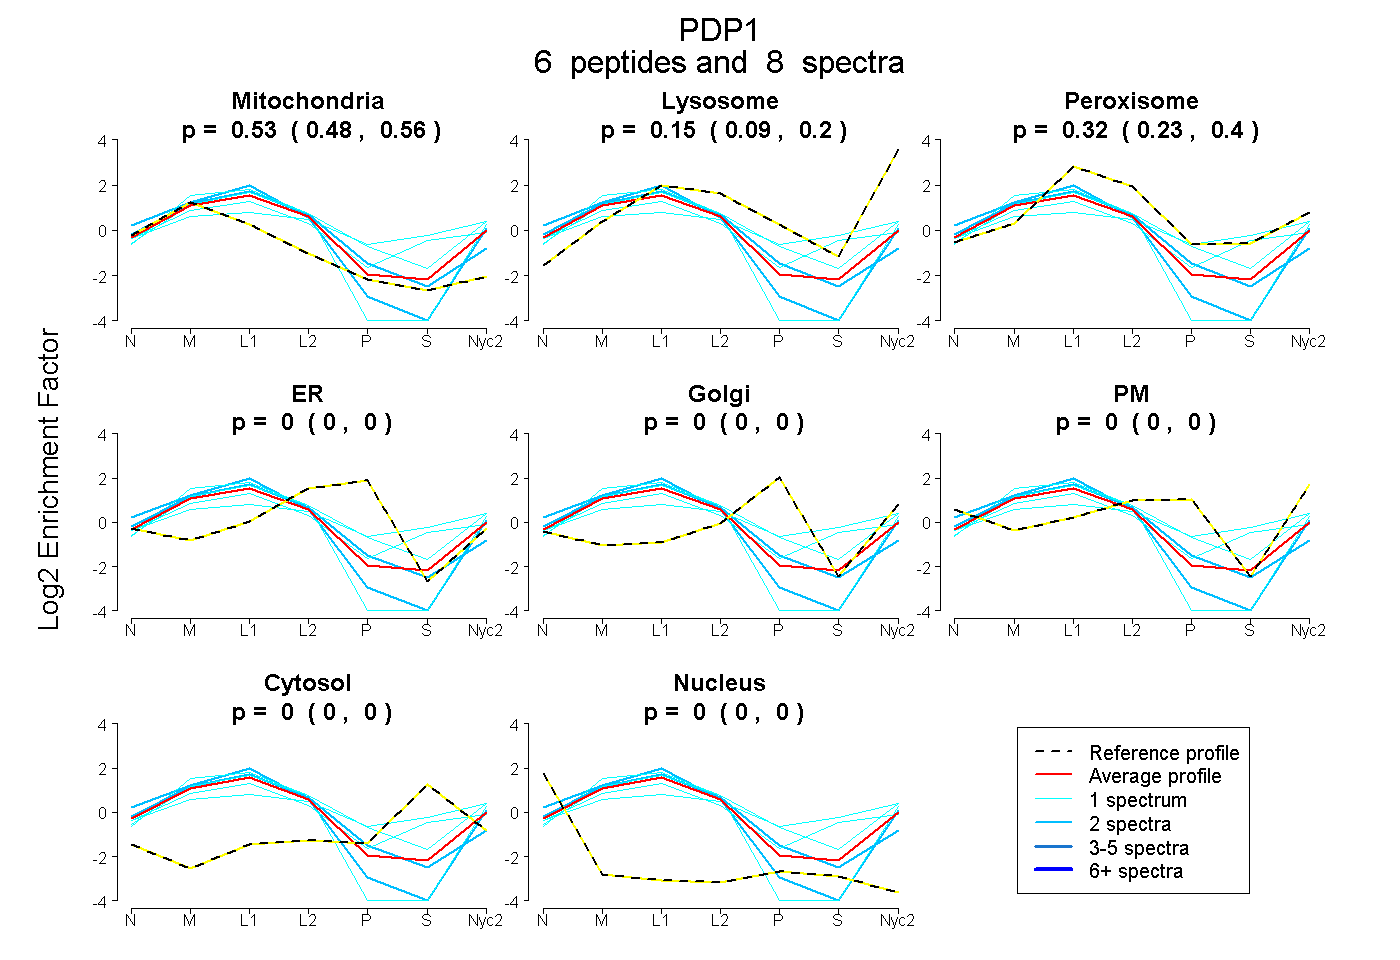
0.484 | 0.565
0.085 | 0.202
0.228 | 0.397
0.000 | 0.000
0.000 | 0.000
0.000 | 0.000
0.000 | 0.000
0.000 | 0.000
11peptides
spectra
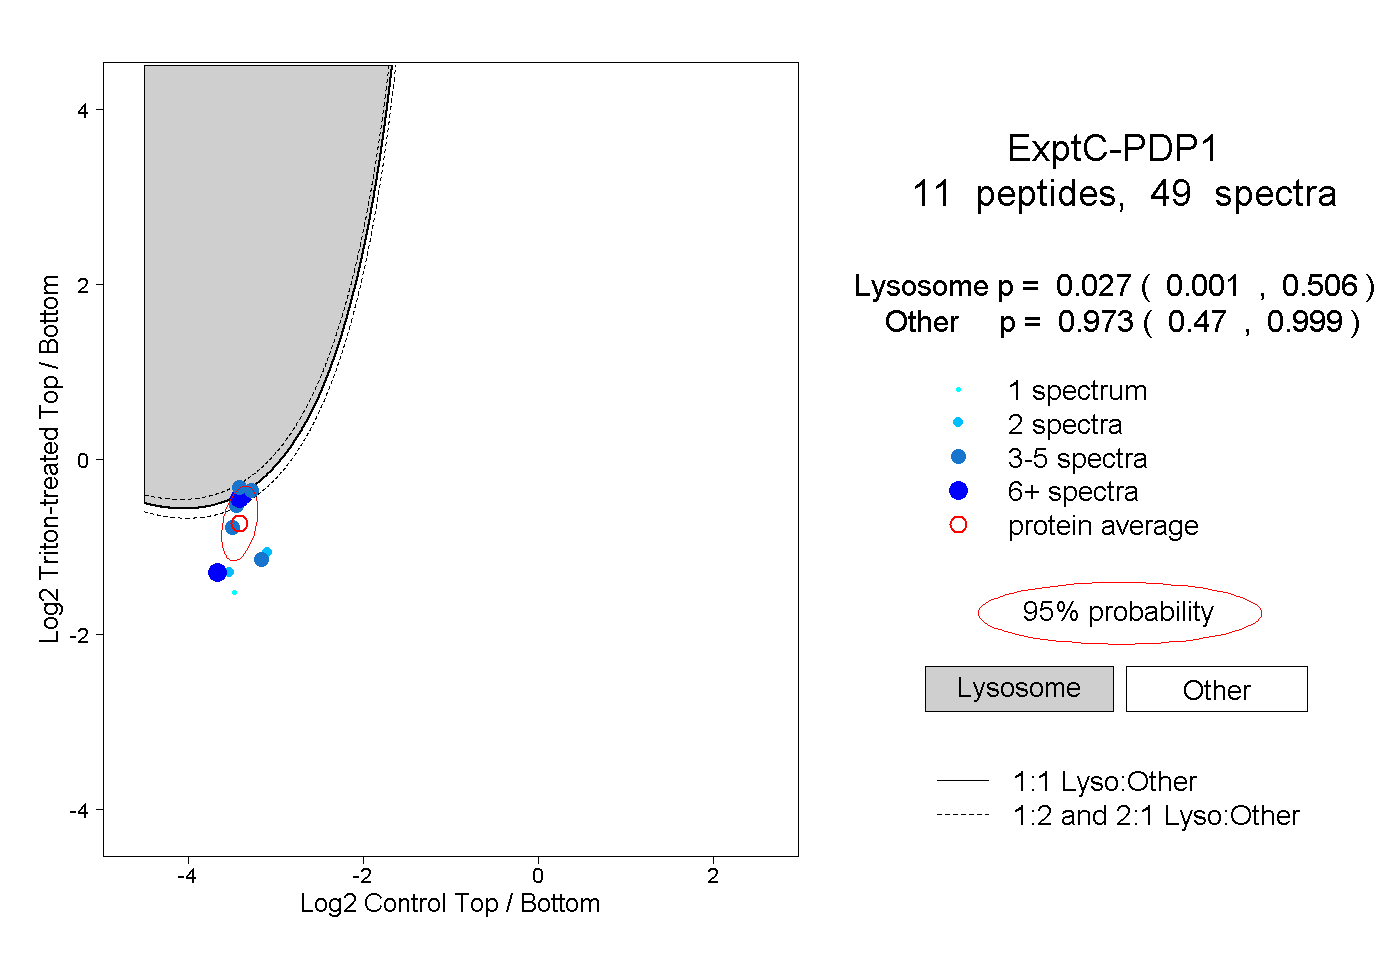
0.001 | 0.506
0.470 | 0.999
3peptides
spectra
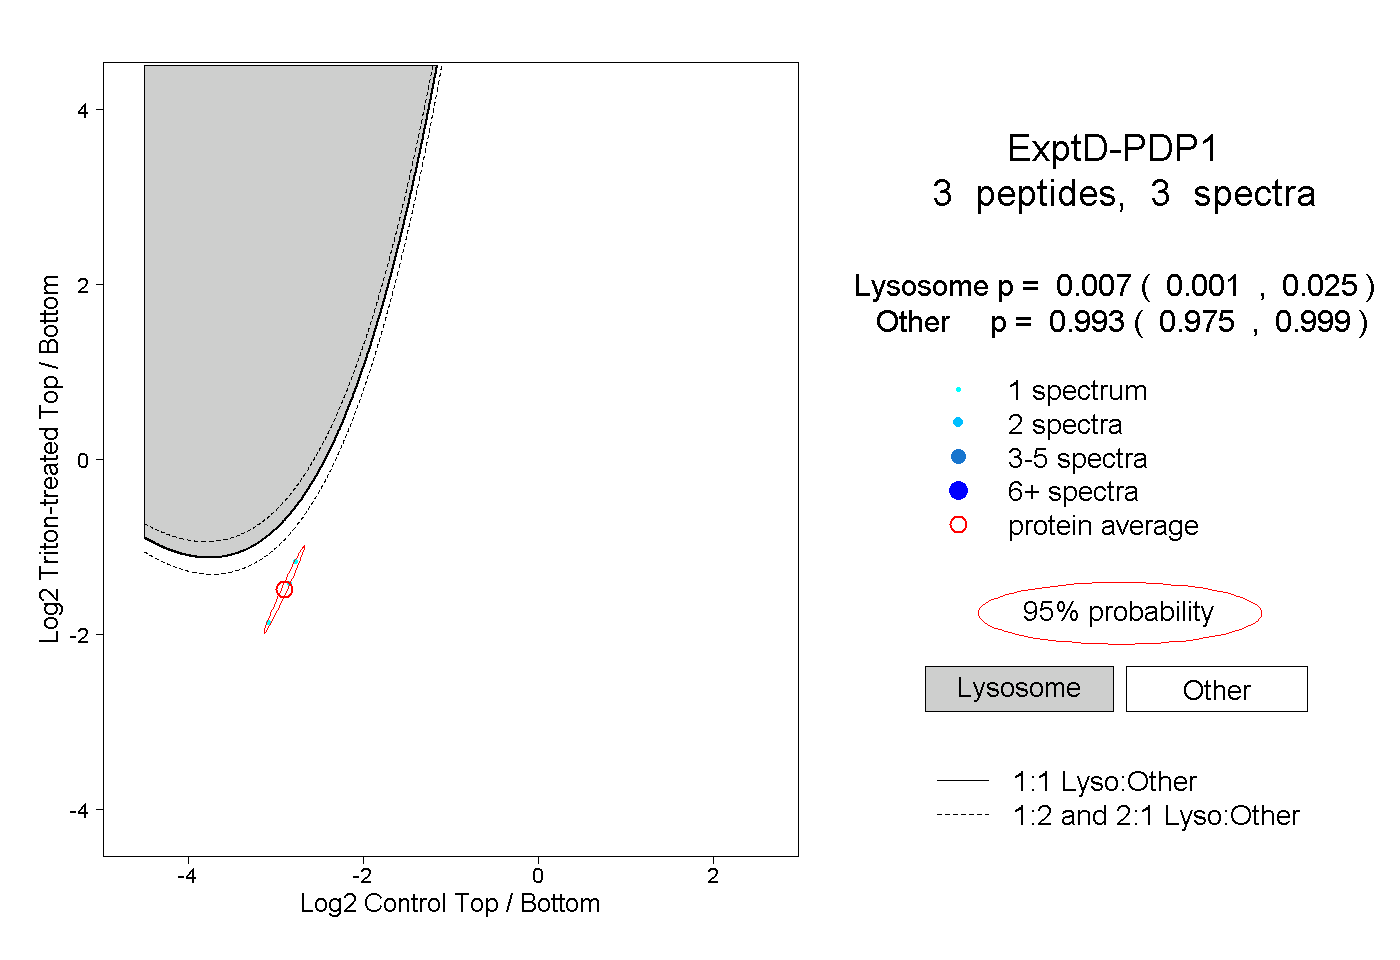
0.001 | 0.025
0.975 | 0.999