 6
6peptides
spectra
0.484 | 0.565
0.085 | 0.202
0.228 | 0.397
0.000 | 0.000
0.000 | 0.000
0.000 | 0.000
0.000 | 0.000
0.000 | 0.000
11peptides
spectra
0.001 | 0.506
0.470 | 0.999
| Plot | Mito | Lyso | Perox | ER | Golgi | PM | Cytosol | Nucleus | |||||
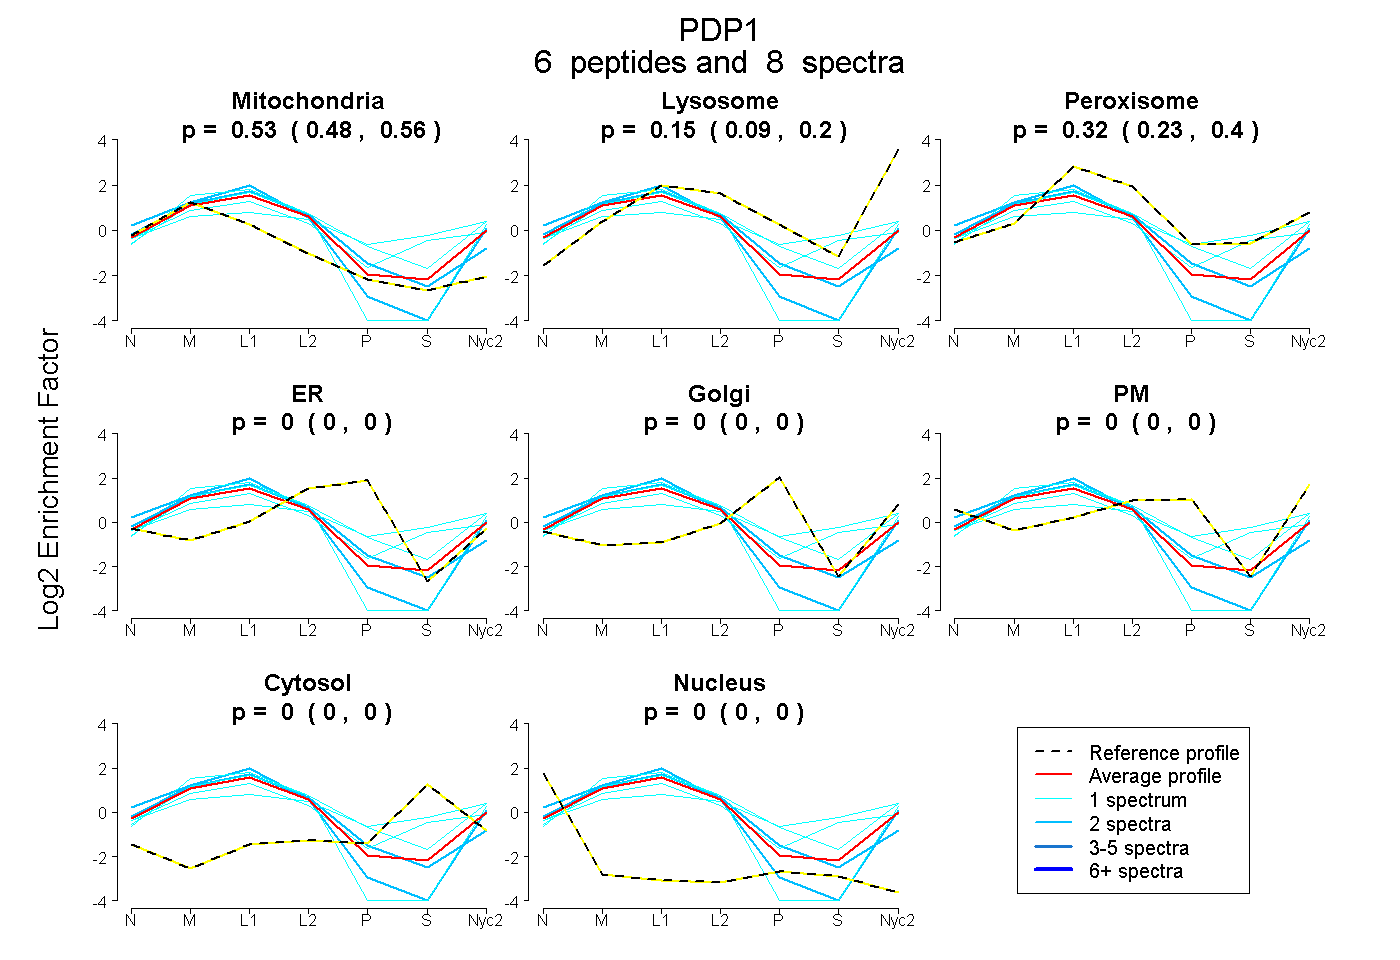
| Expt A |
6 peptides |
8 spectra |
|
0.527 0.484 | 0.565 |
0.149 0.085 | 0.202 |
0.323 0.228 | 0.397 |
0.000 0.000 | 0.000 |
0.000 0.000 | 0.000 |
0.000 0.000 | 0.000 |
0.000 0.000 | 0.000 |
0.000 0.000 | 0.000 |
||
| Plot | Lyso | Other | |||||||||||
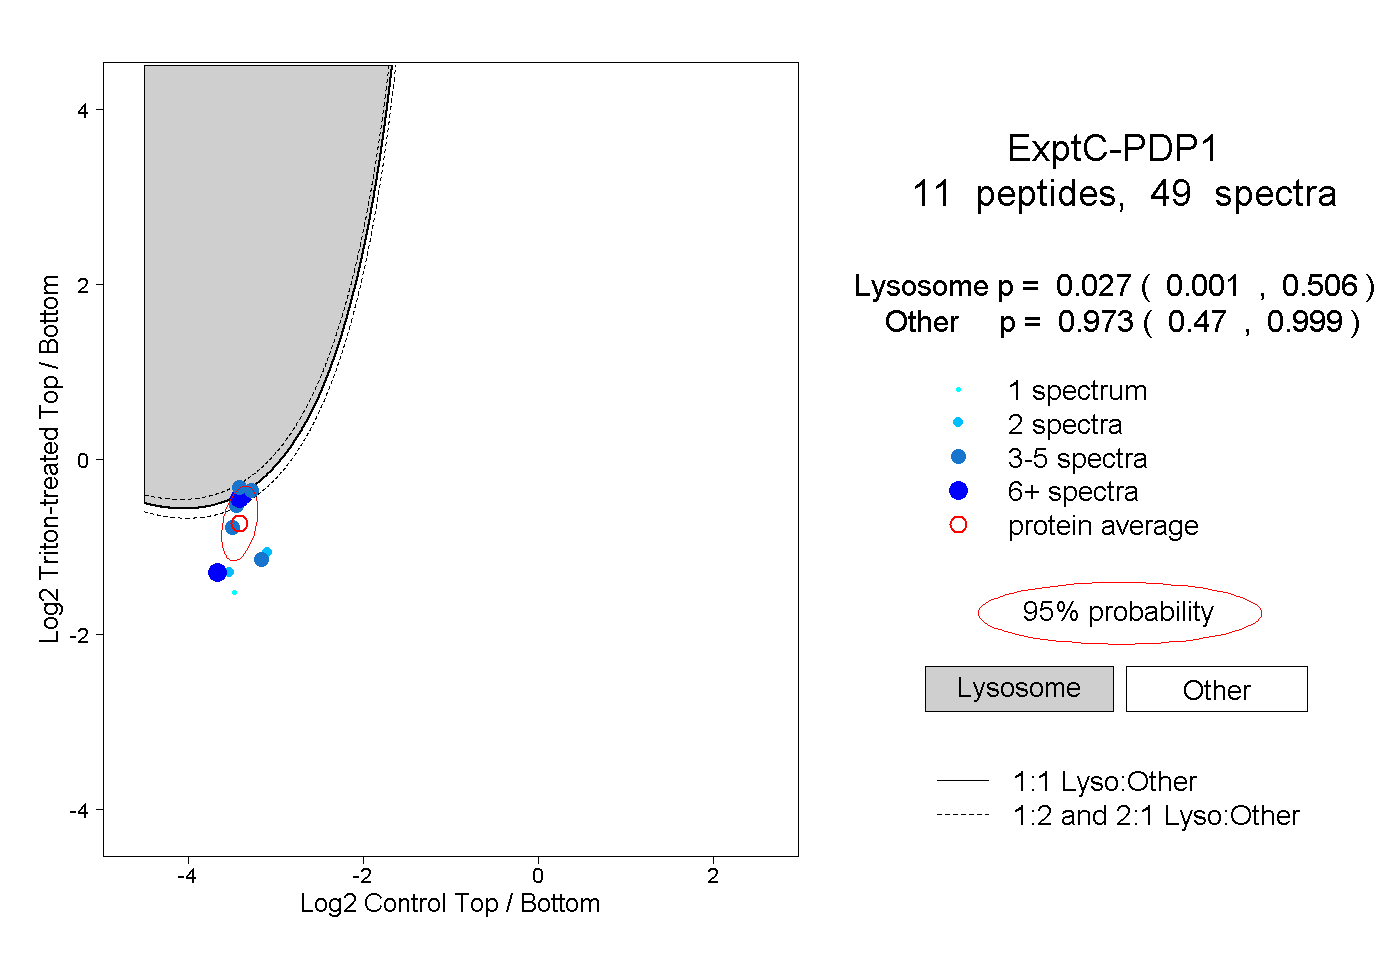
| Expt C |
11 peptides |
49 spectra |
|
0.027 0.001 | 0.506 |
0.973 0.470 | 0.999 |
| 7 spectra, MLSLPEELAR | 0.389 | 0.611 | ||||||||
| 1 spectrum, IVGEYLTGMHHQQPIAVGGYK | 0.000 | 1.000 | ||||||||
| 2 spectra, FLVLATDGLWETMHR | 0.000 | 1.000 | ||||||||
| 4 spectra, ALLPILQWHK | 0.024 | 0.976 | ||||||||
| 10 spectra, LYFNSLR | 0.425 | 0.575 | ||||||||
| 4 spectra, VPEFDGK | 0.722 | 0.278 | ||||||||
| 3 spectra, SAATCLQTR | 0.402 | 0.598 | ||||||||
| 4 spectra, AFGDVK | 0.250 | 0.750 | ||||||||
| 2 spectra, HPNDYFSK | 0.000 | 1.000 | ||||||||
| 5 spectra, VTLGQMHGLLTER | 0.000 | 1.000 | ||||||||
| 7 spectra, LRPQDK | 0.000 | 1.000 |
| Plot | Lyso | Other | |||||||||||
| Expt D |
3 peptides |
3 spectra |
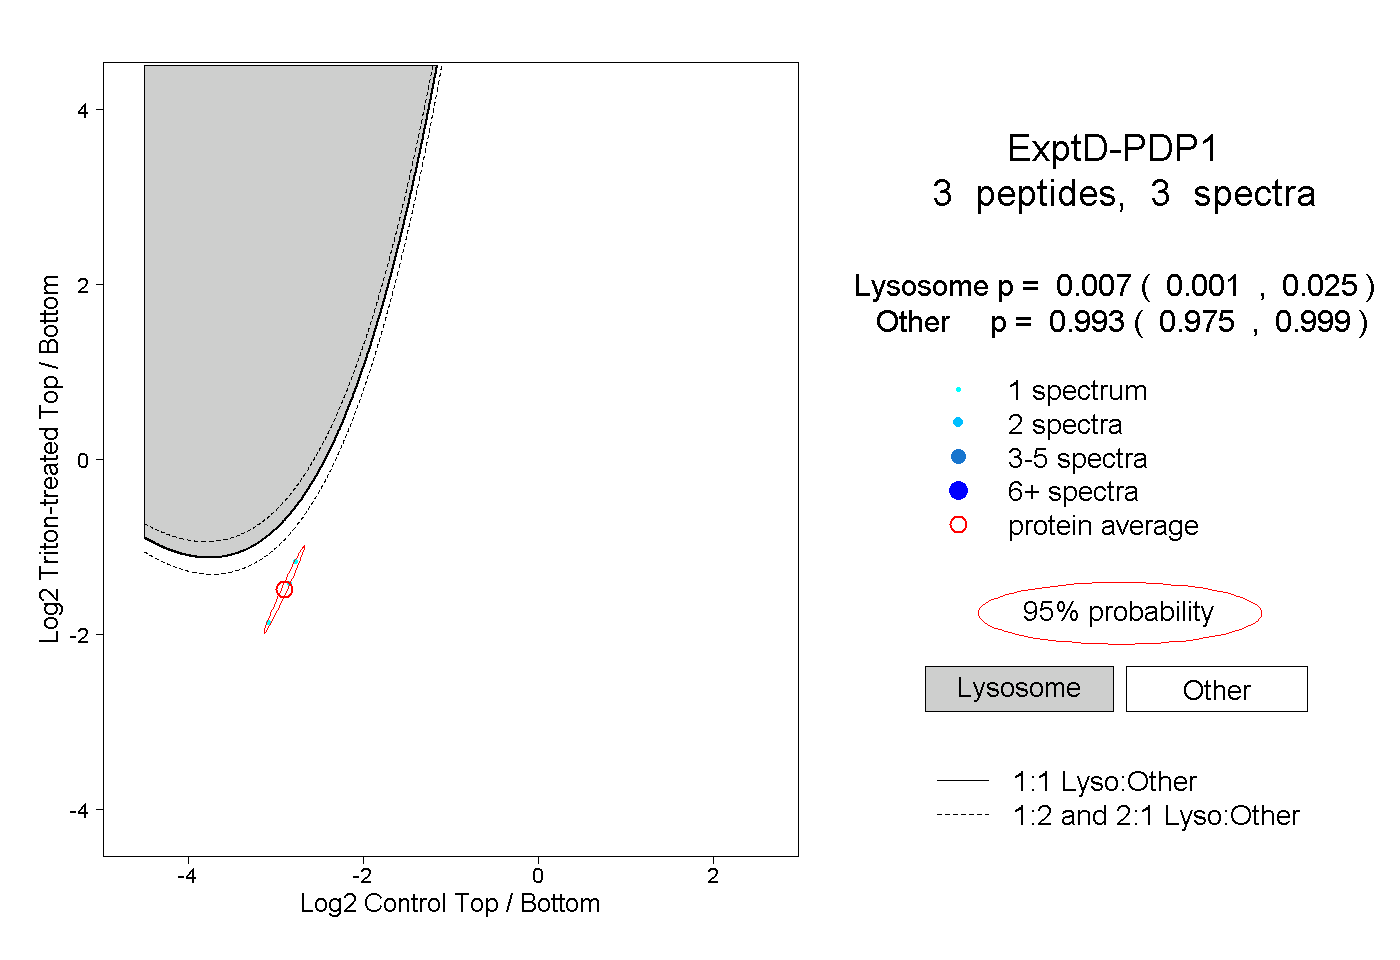 |
0.007 0.001 | 0.025 |
0.993 0.975 | 0.999 |