 5
5peptides
spectra
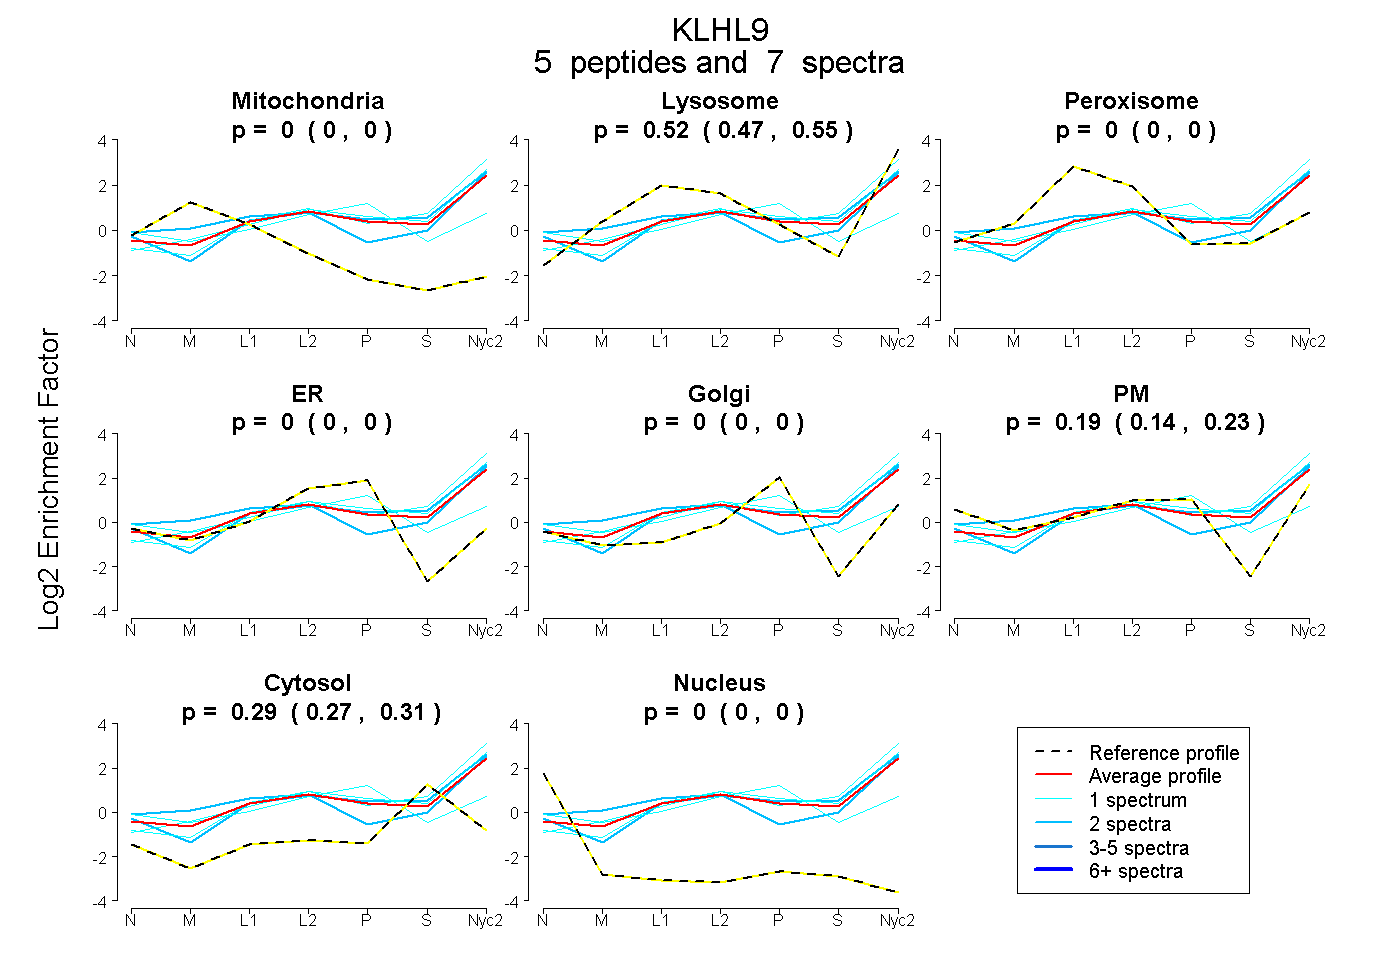
0.000 | 0.000
0.473 | 0.551
0.000 | 0.000
0.000 | 0.000
0.000 | 0.000
0.144 | 0.229
0.266 | 0.313
0.000 | 0.000
1peptide
spectrum
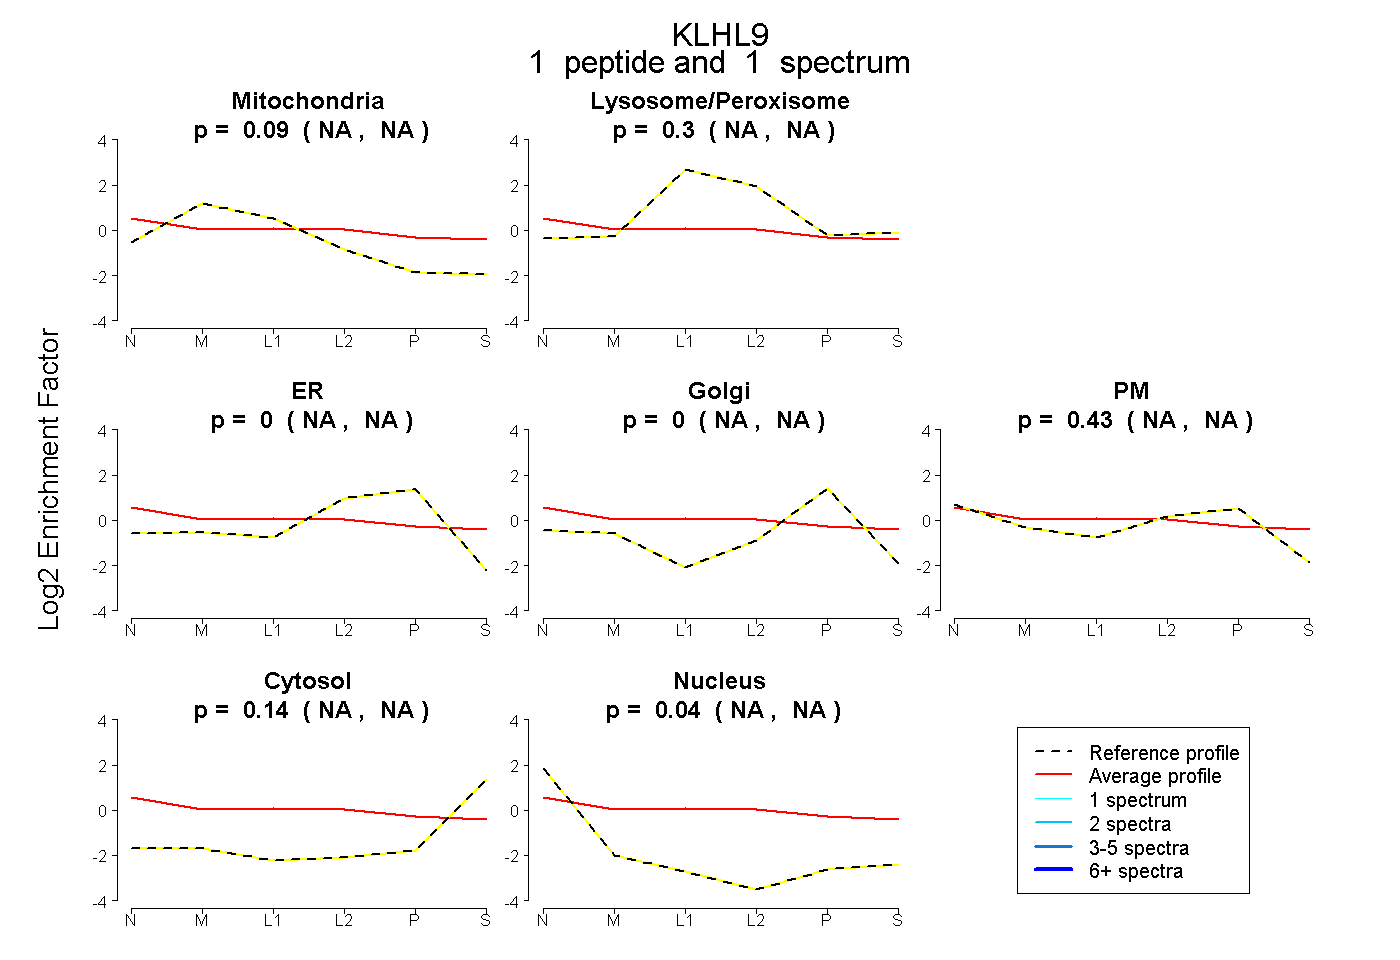
NA | NA
NA | NA
NA | NA
NA | NA
NA | NA
NA | NA
NA | NA
9peptides
spectra
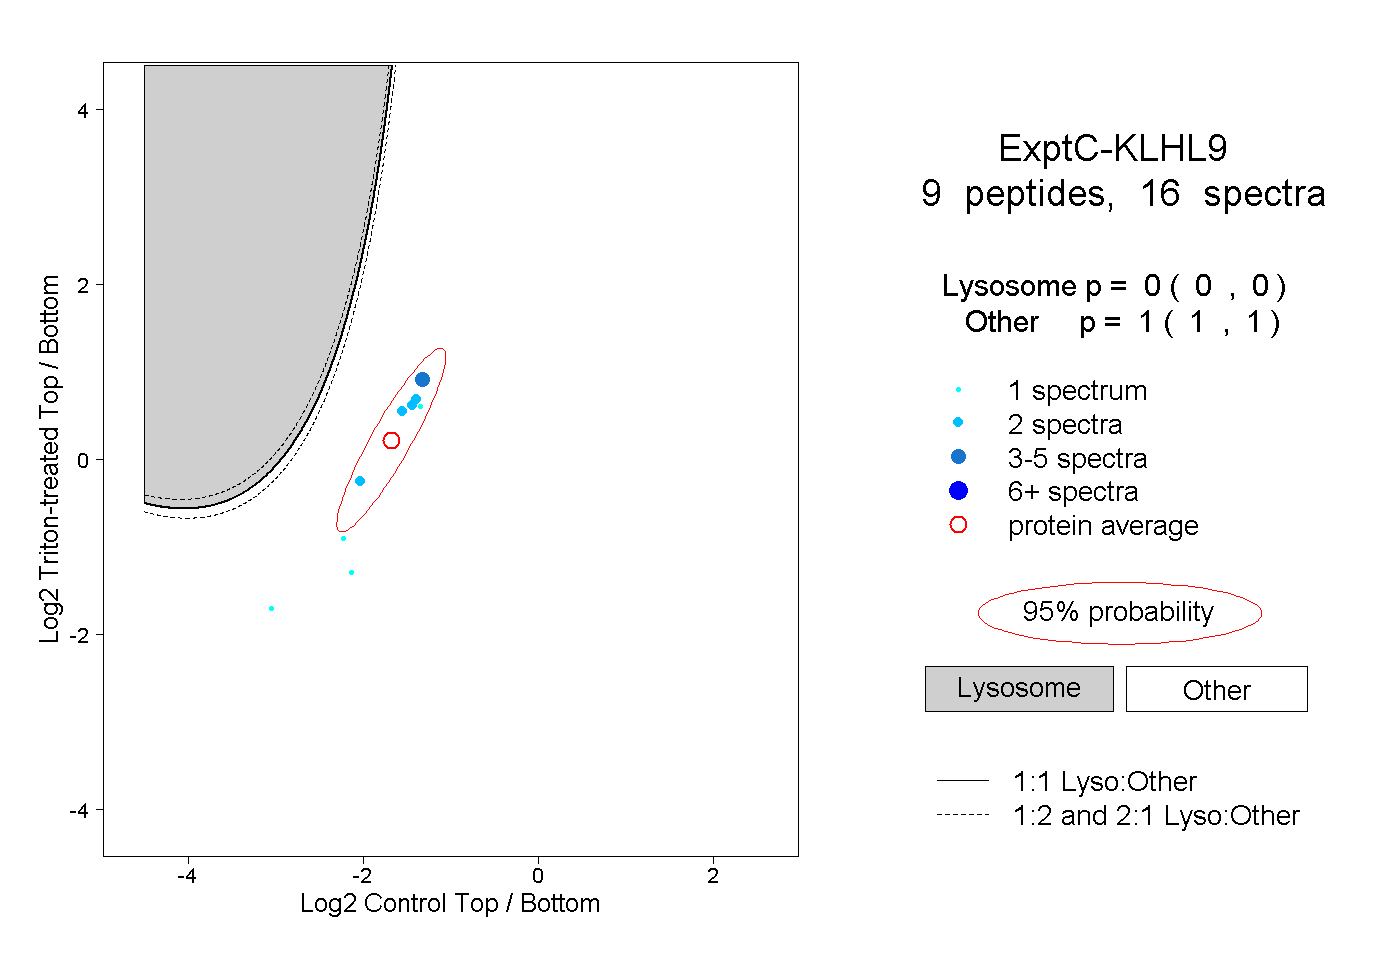
0.000 | 0.000
1.000 | 1.000
2peptides
spectra
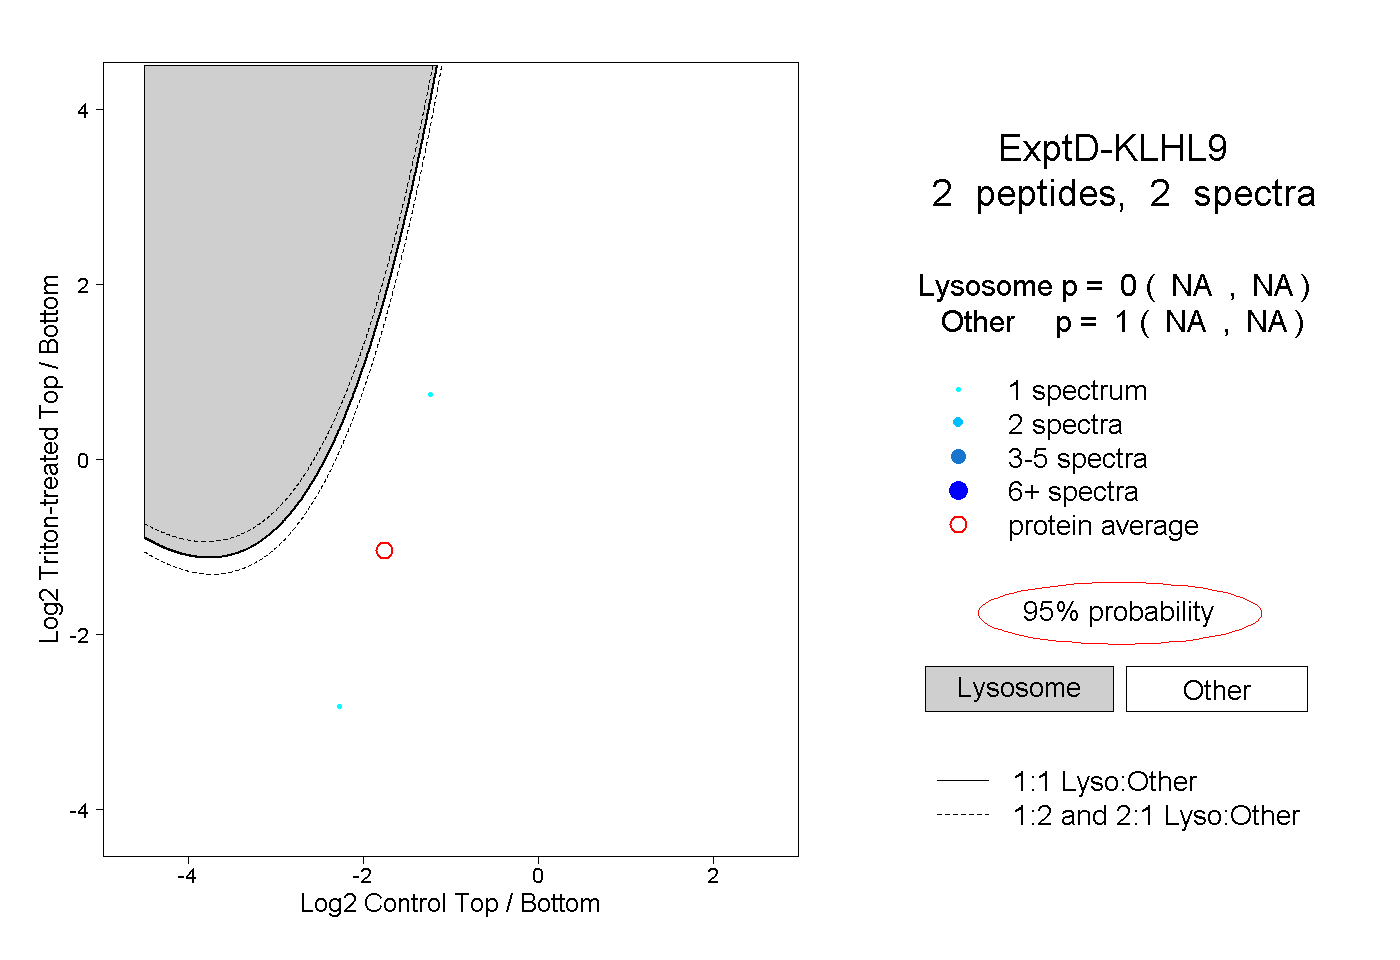
NA | NA
NA | NA