 5
5peptides
spectra
0.000 | 0.000
0.473 | 0.551
0.000 | 0.000
0.000 | 0.000
0.000 | 0.000
0.144 | 0.229
0.266 | 0.313
0.000 | 0.000
| Plot | Mito | Lyso | Perox | ER | Golgi | PM | Cytosol | Nucleus | |||||
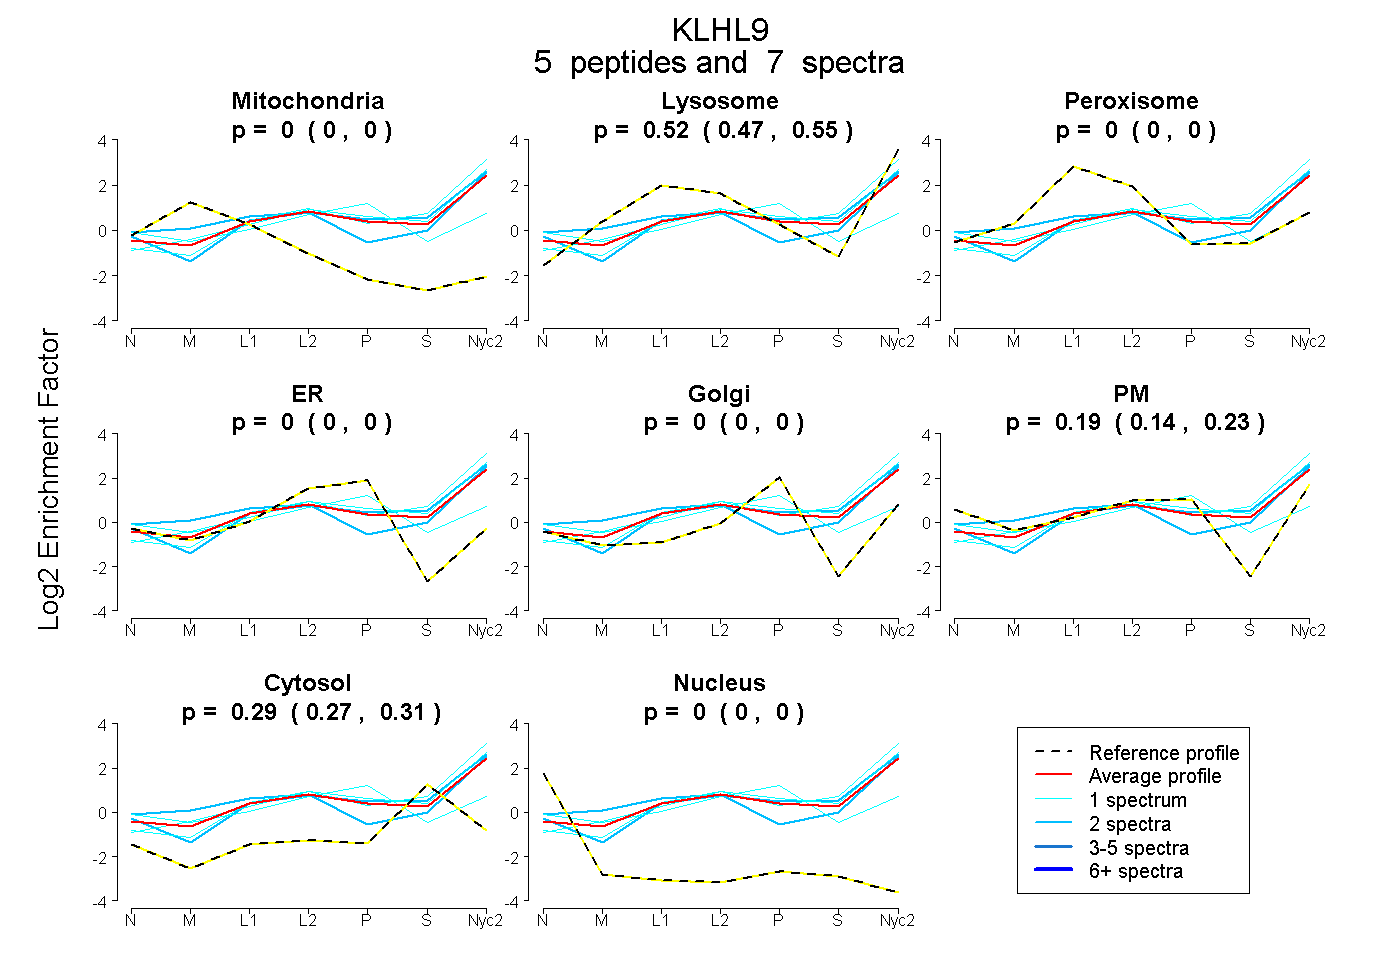
| Expt A |
5 peptides |
7 spectra |
|
0.000 0.000 | 0.000 |
0.516 0.473 | 0.551 |
0.000 0.000 | 0.000 |
0.000 0.000 | 0.000 |
0.000 0.000 | 0.000 |
0.192 0.144 | 0.229 |
0.292 0.266 | 0.313 |
0.000 0.000 | 0.000 |
| 1 spectrum, TAVDTVFR | 0.000 | 0.680 | 0.000 | 0.000 | 0.000 | 0.000 | 0.320 | 0.000 | ||
| 2 spectra, LAFVLSSNSLK | 0.000 | 0.526 | 0.075 | 0.000 | 0.000 | 0.157 | 0.242 | 0.000 | ||
| 2 spectra, LYVIGGNHFR | 0.000 | 0.508 | 0.000 | 0.000 | 0.000 | 0.160 | 0.332 | 0.000 | ||
| 1 spectrum, WMQVASLNEK | 0.000 | 0.646 | 0.000 | 0.000 | 0.076 | 0.009 | 0.269 | 0.000 | ||
| 1 spectrum, SAAGELATVECYNPR | 0.000 | 0.000 | 0.294 | 0.000 | 0.417 | 0.137 | 0.152 | 0.000 |
| Plot | Mito | Lyso or Perox | ER | Golgi | PM | Cytosol | Nucleus | ||||||
| Expt B |
1 peptide |
1 spectrum |
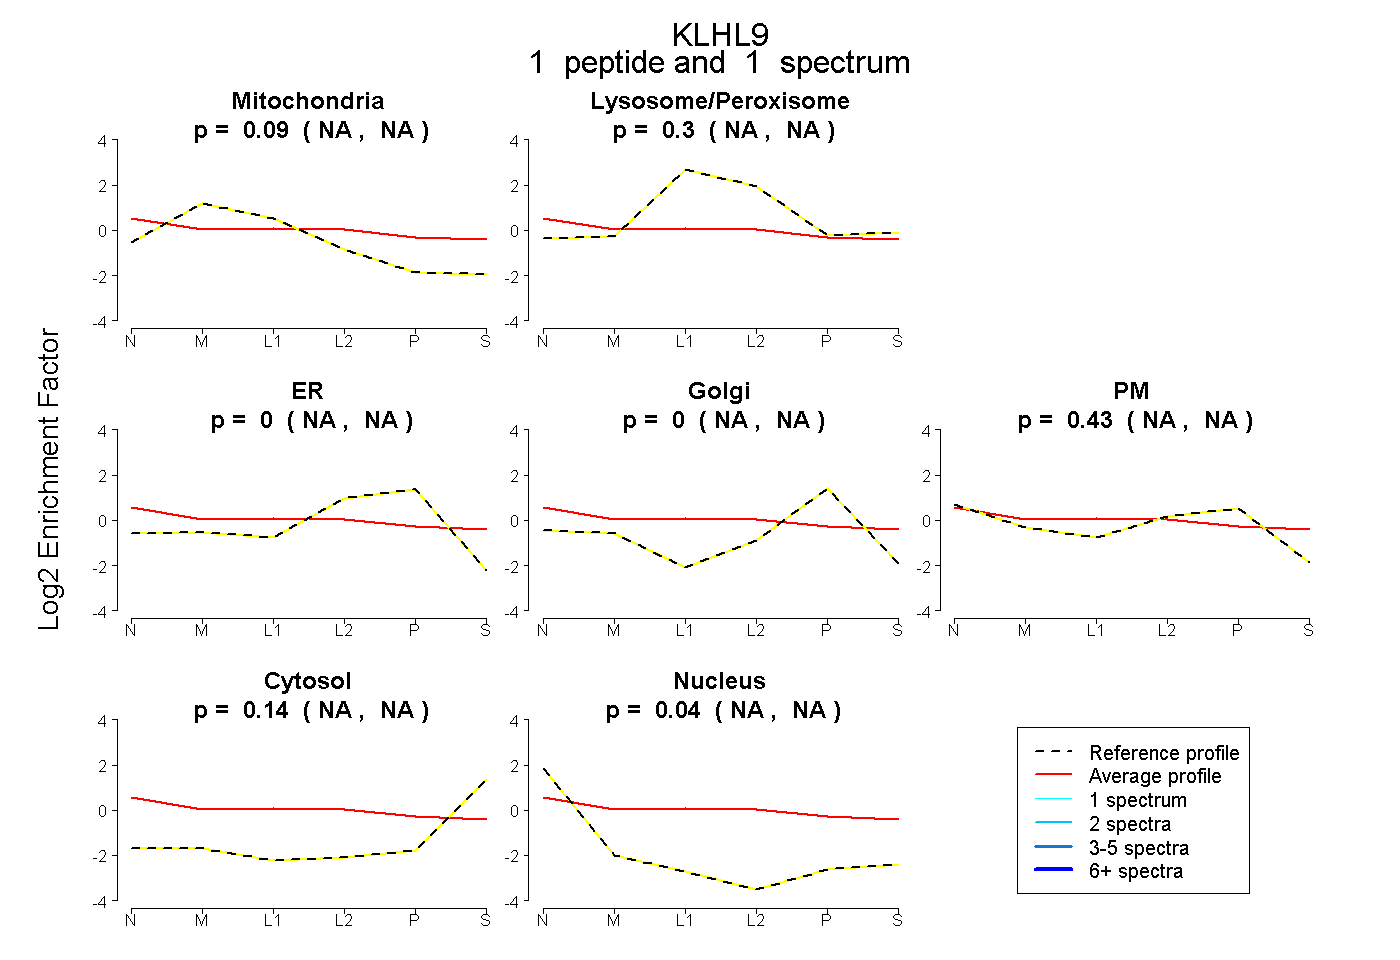 |
0.087 NA | NA |
0.303 NA | NA |
0.000 NA | NA |
0.000 NA | NA |
0.434 NA | NA |
0.135 NA | NA |
0.040 NA | NA |
|||
| Plot | Lyso | Other | |||||||||||
| Expt C |
9 peptides |
16 spectra |
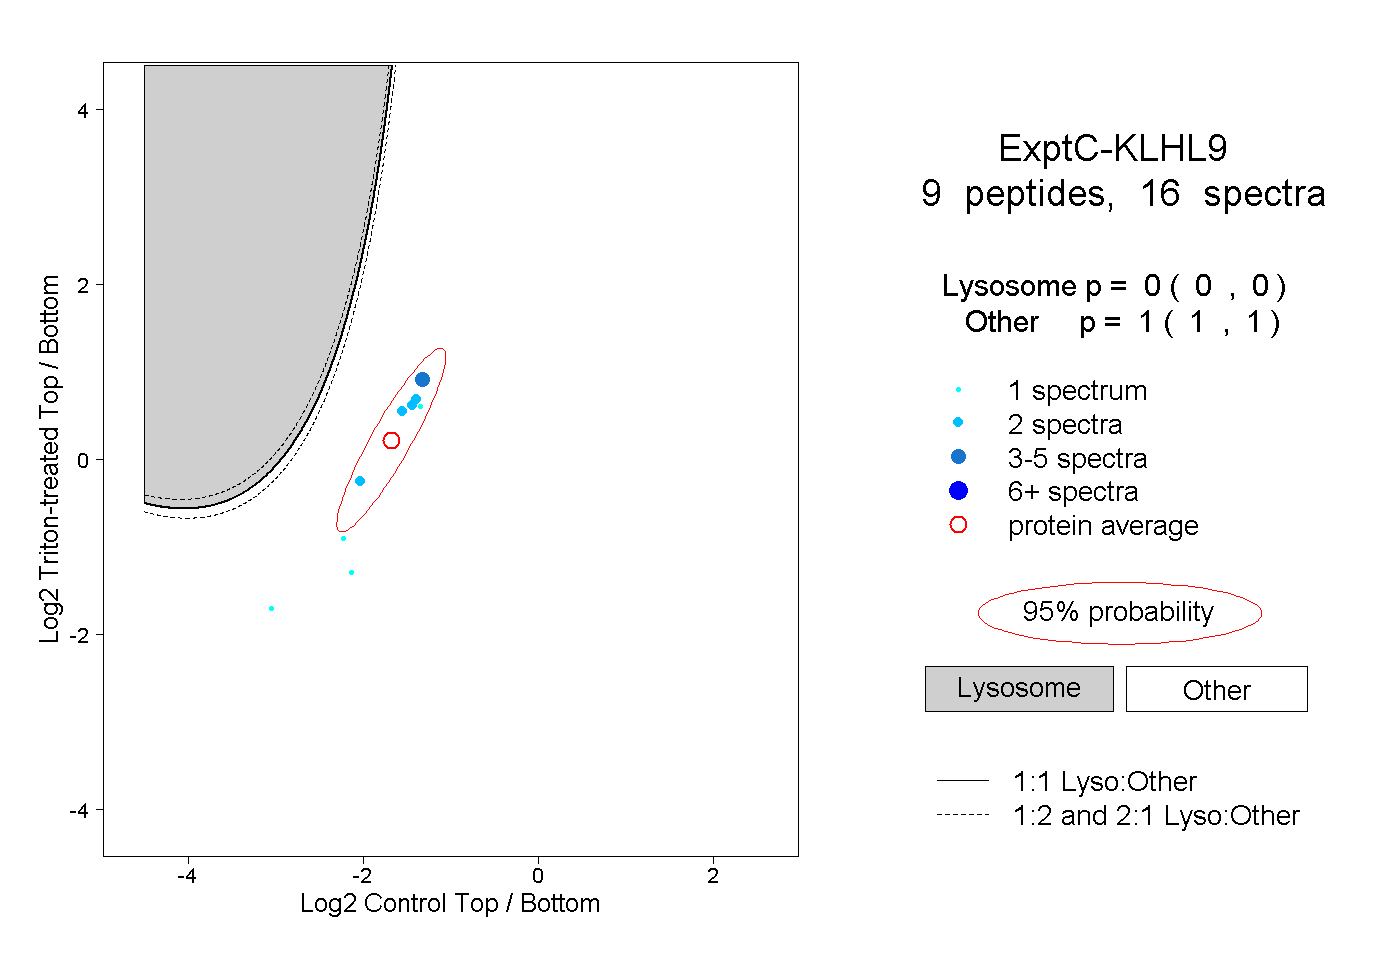 |
0.000 0.000 | 0.000 |
1.000 1.000 | 1.000 |
||||||||
| Plot | Lyso | Other | |||||||||||
| Expt D |
2 peptides |
2 spectra |
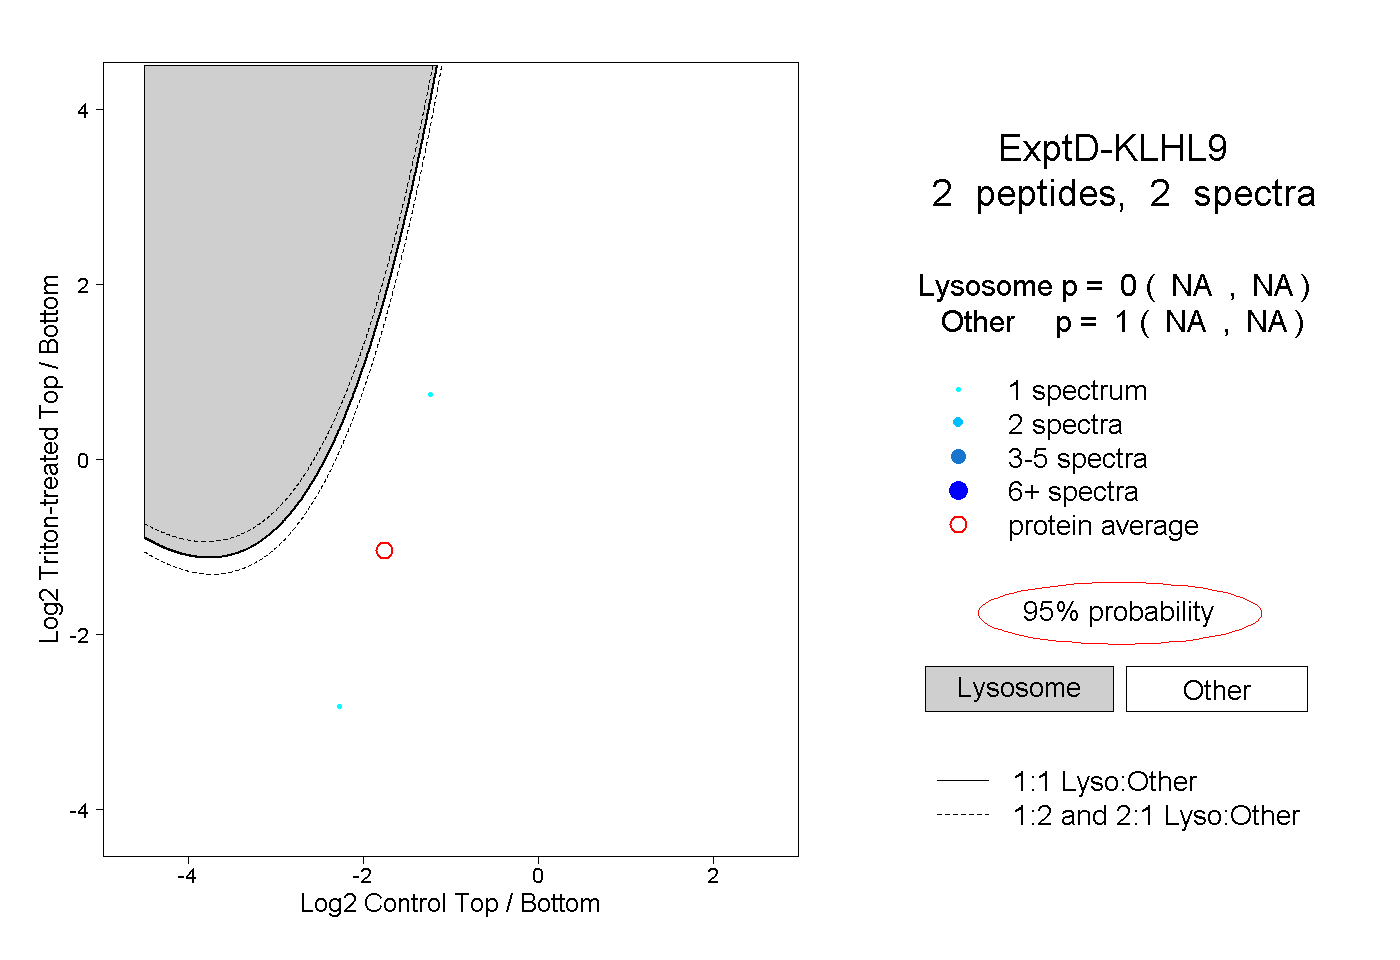 |
0.000 NA | NA |
1.000 NA | NA |