 15
15peptides
spectra
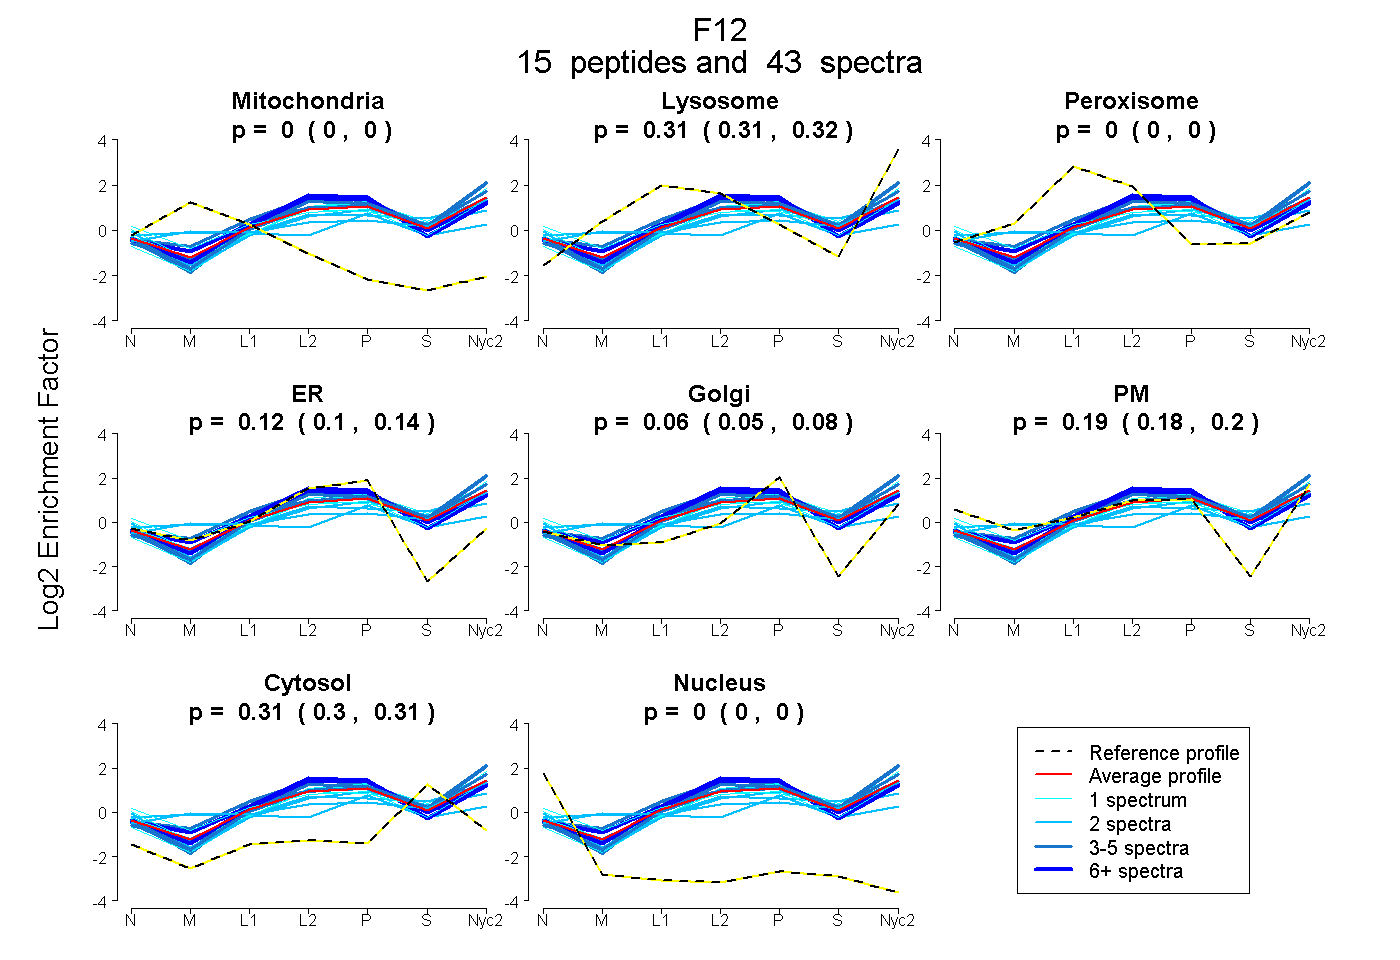
0.000 | 0.000
0.309 | 0.320
0.000 | 0.000
0.104 | 0.137
0.046 | 0.077
0.183 | 0.203
0.300 | 0.309
0.000 | 0.000
5peptides
spectra
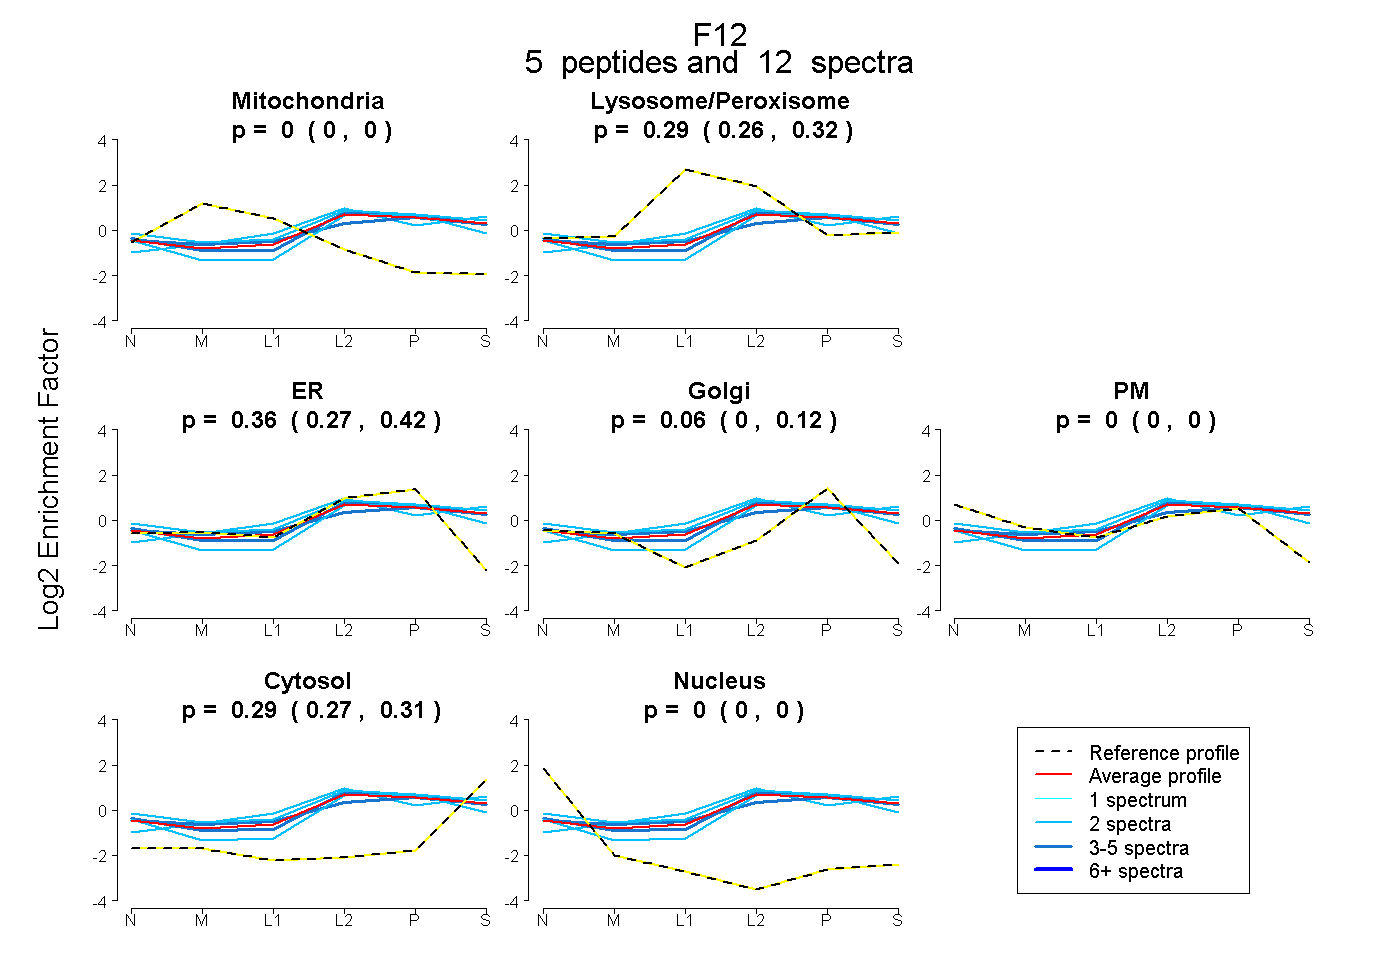
0.000 | 0.000
0.262 | 0.324
0.271 | 0.420
0.000 | 0.118
0.000 | 0.000
0.266 | 0.308
0.000 | 0.000
14peptides
spectra
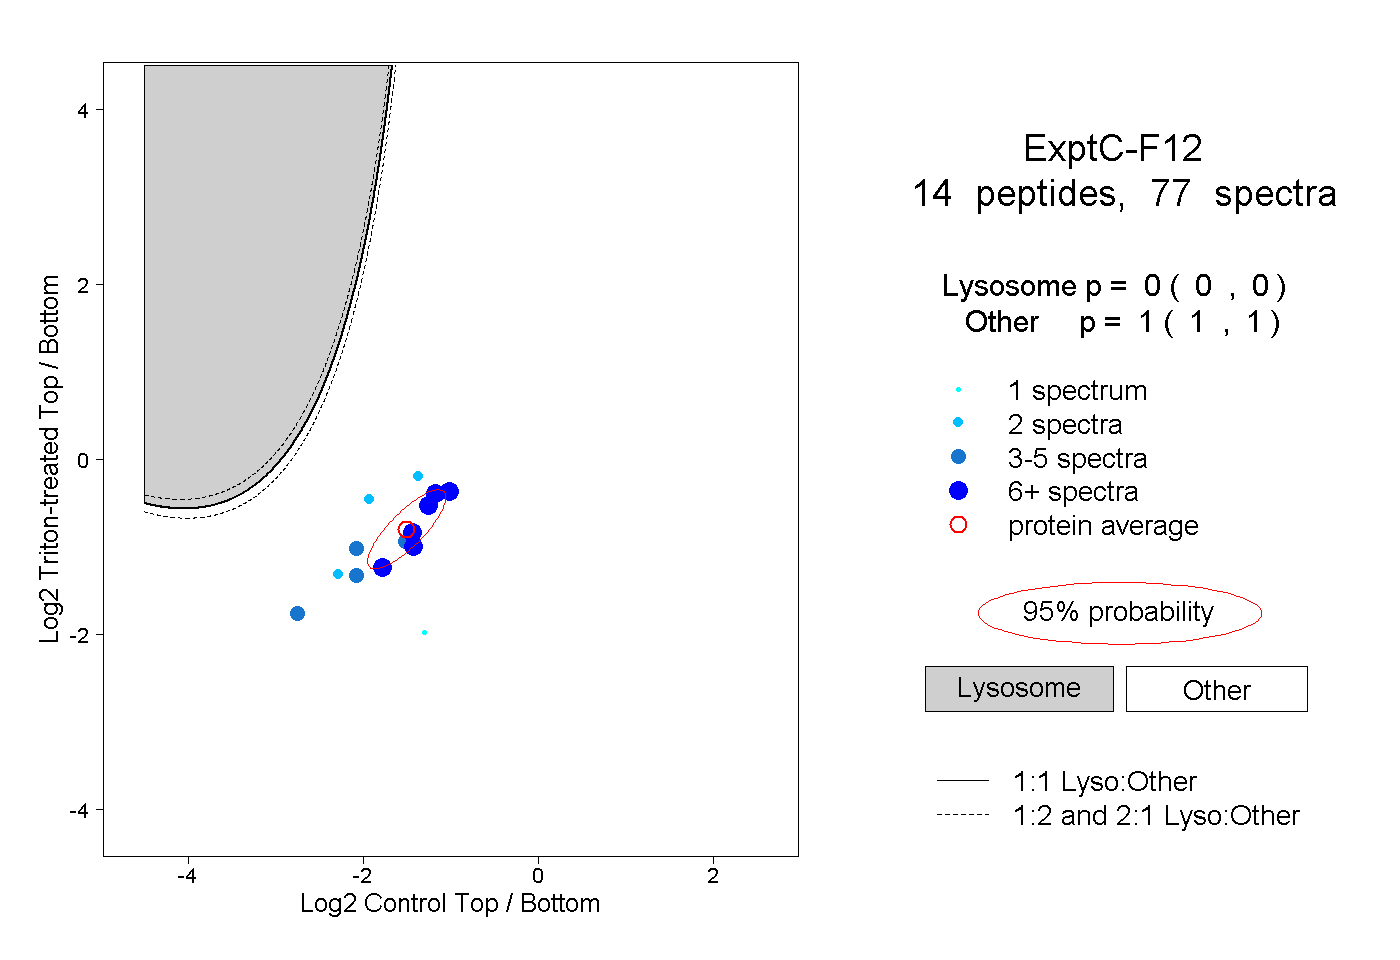
0.000 | 0.000
1.000 | 1.000
5peptides
spectra
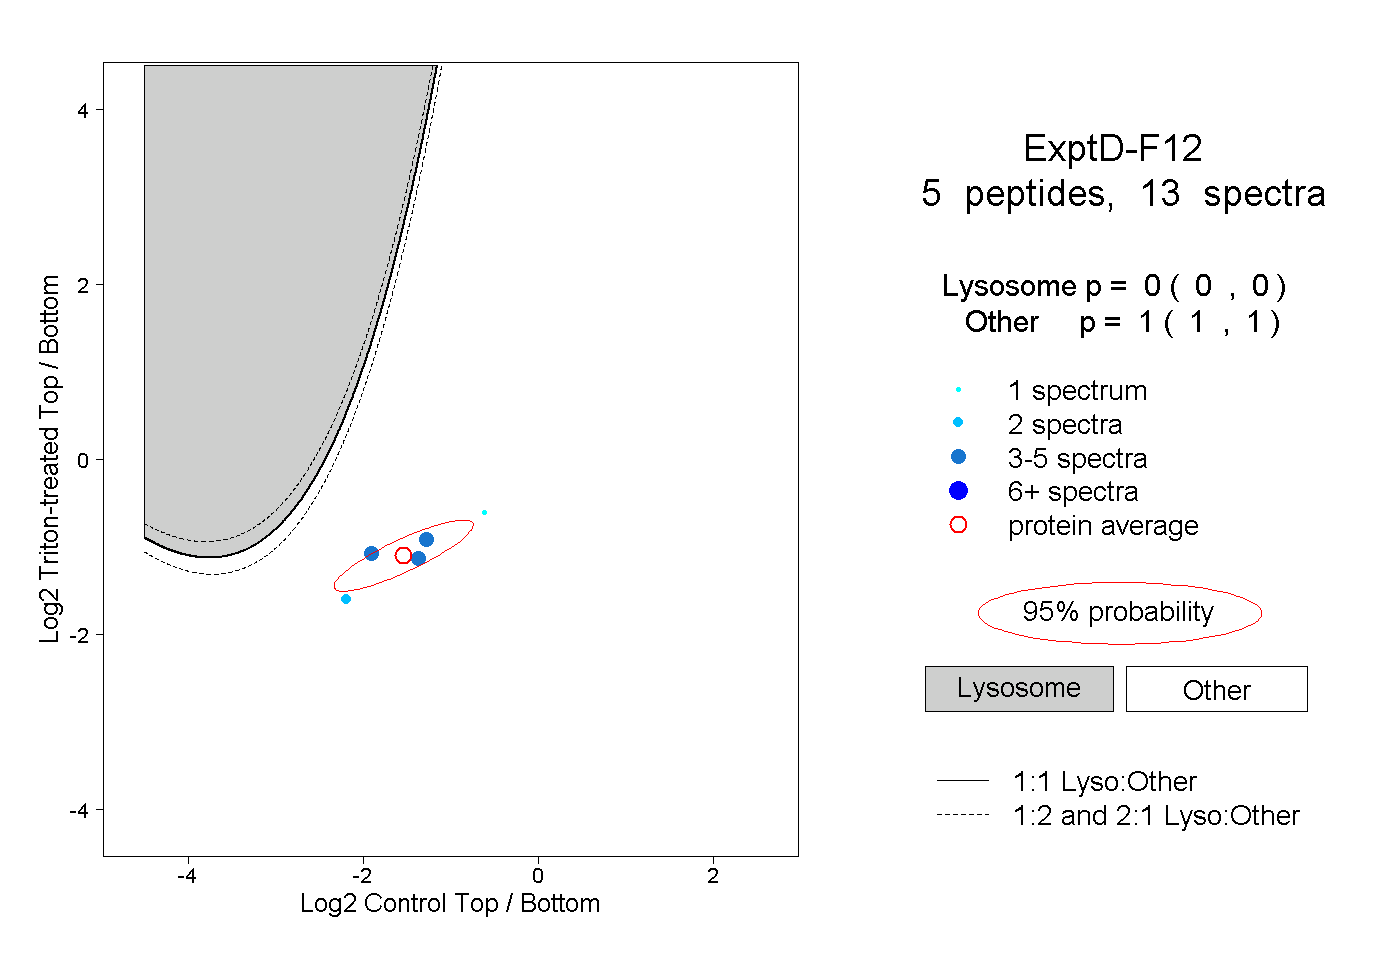
0.000 | 0.000
1.000 | 1.000