 15
15peptides
spectra
0.000 | 0.000
0.309 | 0.320
0.000 | 0.000
0.104 | 0.137
0.046 | 0.077
0.183 | 0.203
0.300 | 0.309
0.000 | 0.000
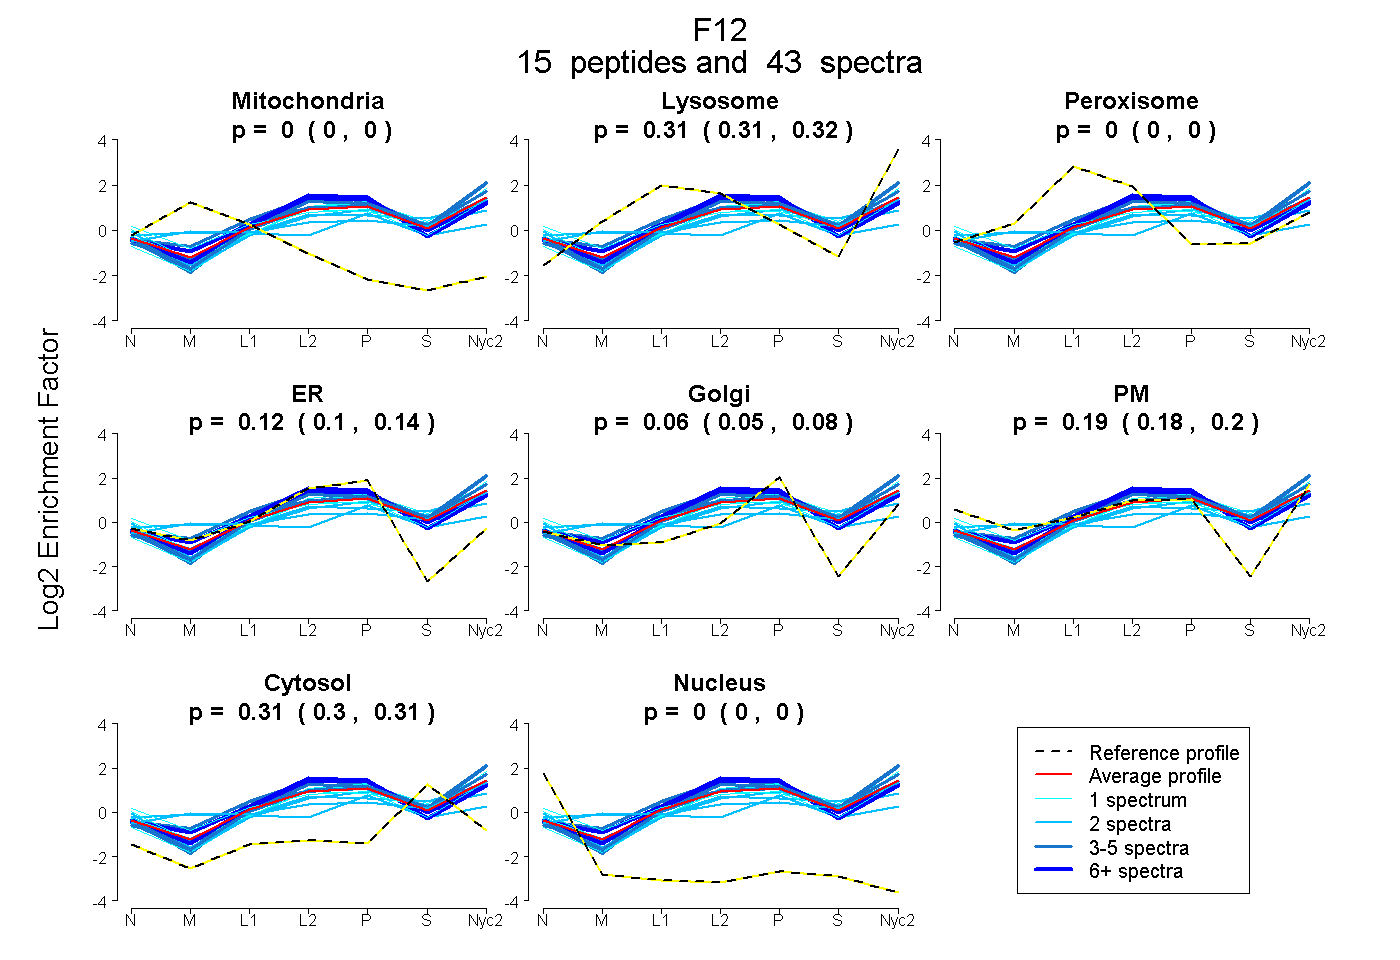
| Plot | Mito | Lyso | Perox | ER | Golgi | PM | Cytosol | Nucleus | |||||
| Expt A |
15 peptides |
43 spectra |
|
0.000 0.000 | 0.000 |
0.315 0.309 | 0.320 |
0.000 0.000 | 0.000 |
0.123 0.104 | 0.137 |
0.063 0.046 | 0.077 |
0.194 0.183 | 0.203 |
0.305 0.300 | 0.309 |
0.000 0.000 | 0.000 |
| 1 spectrum, RPAPEELTVVLGQDR | 0.000 | 0.309 | 0.000 | 0.000 | 0.206 | 0.242 | 0.242 | 0.000 | ||
| 3 spectra, FFHENEIWFR | 0.000 | 0.456 | 0.000 | 0.149 | 0.097 | 0.060 | 0.239 | 0.000 | ||
| 2 spectra, CQTLAVHSYR | 0.050 | 0.000 | 0.264 | 0.000 | 0.436 | 0.000 | 0.250 | 0.000 | ||
| 4 spectra, TTLSGAPCQR | 0.000 | 0.380 | 0.000 | 0.000 | 0.133 | 0.212 | 0.276 | 0.000 | ||
| 4 spectra, TGPGGVAR | 0.000 | 0.396 | 0.000 | 0.064 | 0.161 | 0.083 | 0.297 | 0.000 | ||
| 2 spectra, LHEGFSSK | 0.000 | 0.232 | 0.000 | 0.040 | 0.000 | 0.295 | 0.433 | 0.000 | ||
| 2 spectra, WASEATYR | 0.000 | 0.321 | 0.023 | 0.000 | 0.028 | 0.275 | 0.352 | 0.000 | ||
| 1 spectrum, TYQHDLALLR | 0.000 | 0.131 | 0.091 | 0.000 | 0.000 | 0.526 | 0.252 | 0.000 | ||
| 6 spectra, TSTVVCGQR | 0.000 | 0.326 | 0.000 | 0.356 | 0.000 | 0.059 | 0.259 | 0.000 | ||
| 1 spectrum, NQNVVSR | 0.000 | 0.287 | 0.000 | 0.000 | 0.000 | 0.408 | 0.305 | 0.000 | ||
| 4 spectra, LCHFPFQYHR | 0.000 | 0.258 | 0.184 | 0.061 | 0.233 | 0.059 | 0.205 | 0.000 | ||
| 6 spectra, LLTSQVCR | 0.000 | 0.348 | 0.000 | 0.436 | 0.000 | 0.017 | 0.199 | 0.000 | ||
| 2 spectra, GVISWGSGCGDR | 0.000 | 0.117 | 0.000 | 0.120 | 0.000 | 0.343 | 0.420 | 0.000 | ||
| 1 spectrum, DGAGDPSVVLTVDGK | 0.000 | 0.364 | 0.000 | 0.038 | 0.267 | 0.000 | 0.331 | 0.000 | ||
| 4 spectra, ATCYEDR | 0.000 | 0.308 | 0.000 | 0.175 | 0.108 | 0.087 | 0.322 | 0.000 |
| Plot | Mito | Lyso or Perox | ER | Golgi | PM | Cytosol | Nucleus | ||||||
| Expt B |
5 peptides |
12 spectra |
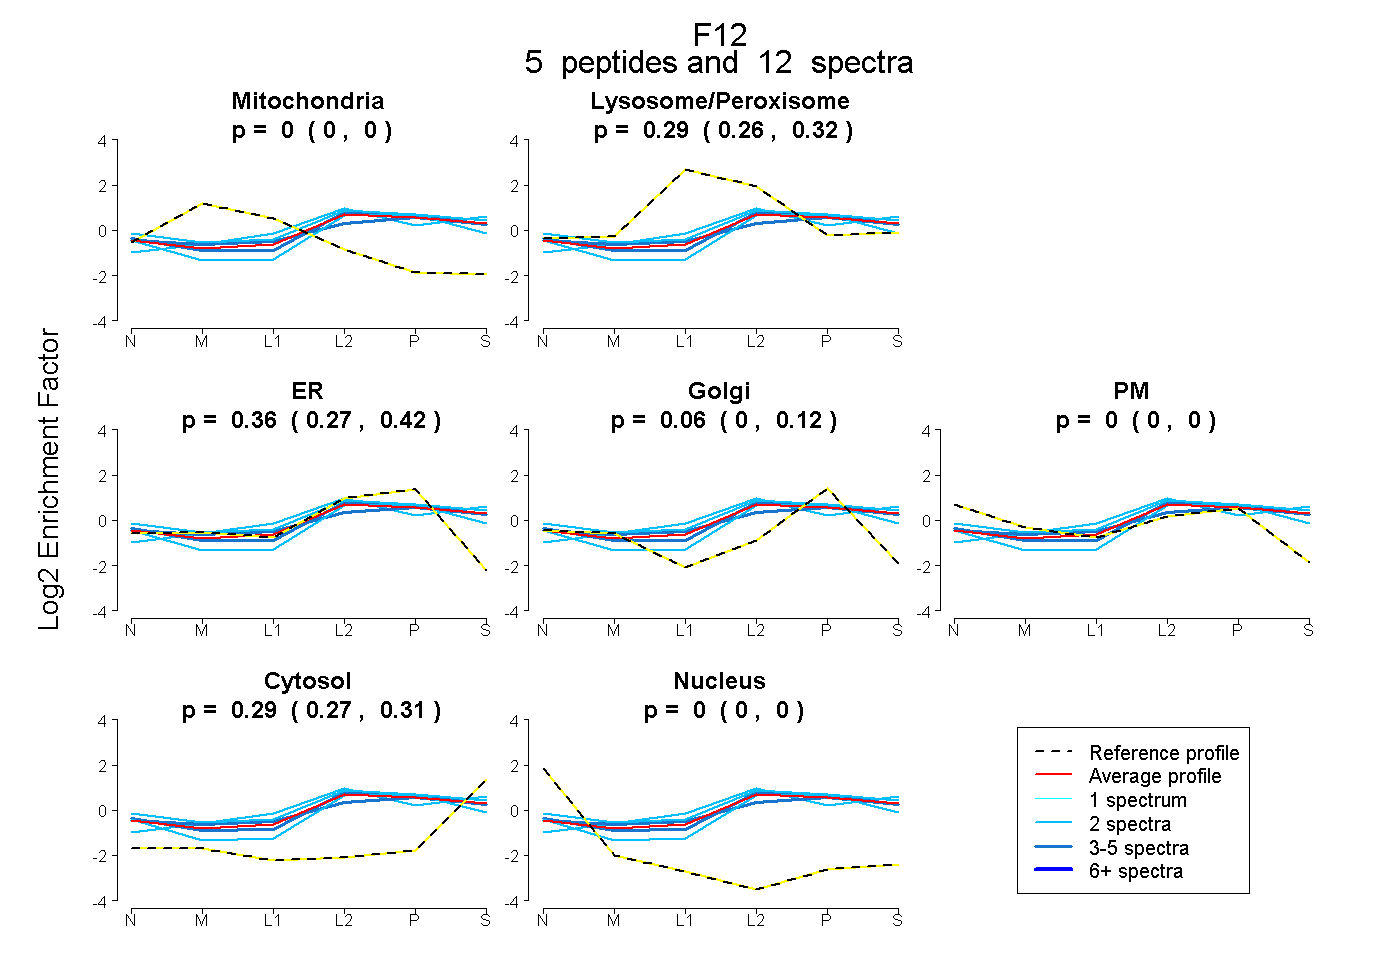 |
0.000 0.000 | 0.000 |
0.294 0.262 | 0.324 |
0.357 0.271 | 0.420 |
0.060 0.000 | 0.118 |
0.000 0.000 | 0.000 |
0.289 0.266 | 0.308 |
0.000 0.000 | 0.000 |
|||
| Plot | Lyso | Other | |||||||||||
| Expt C |
14 peptides |
77 spectra |
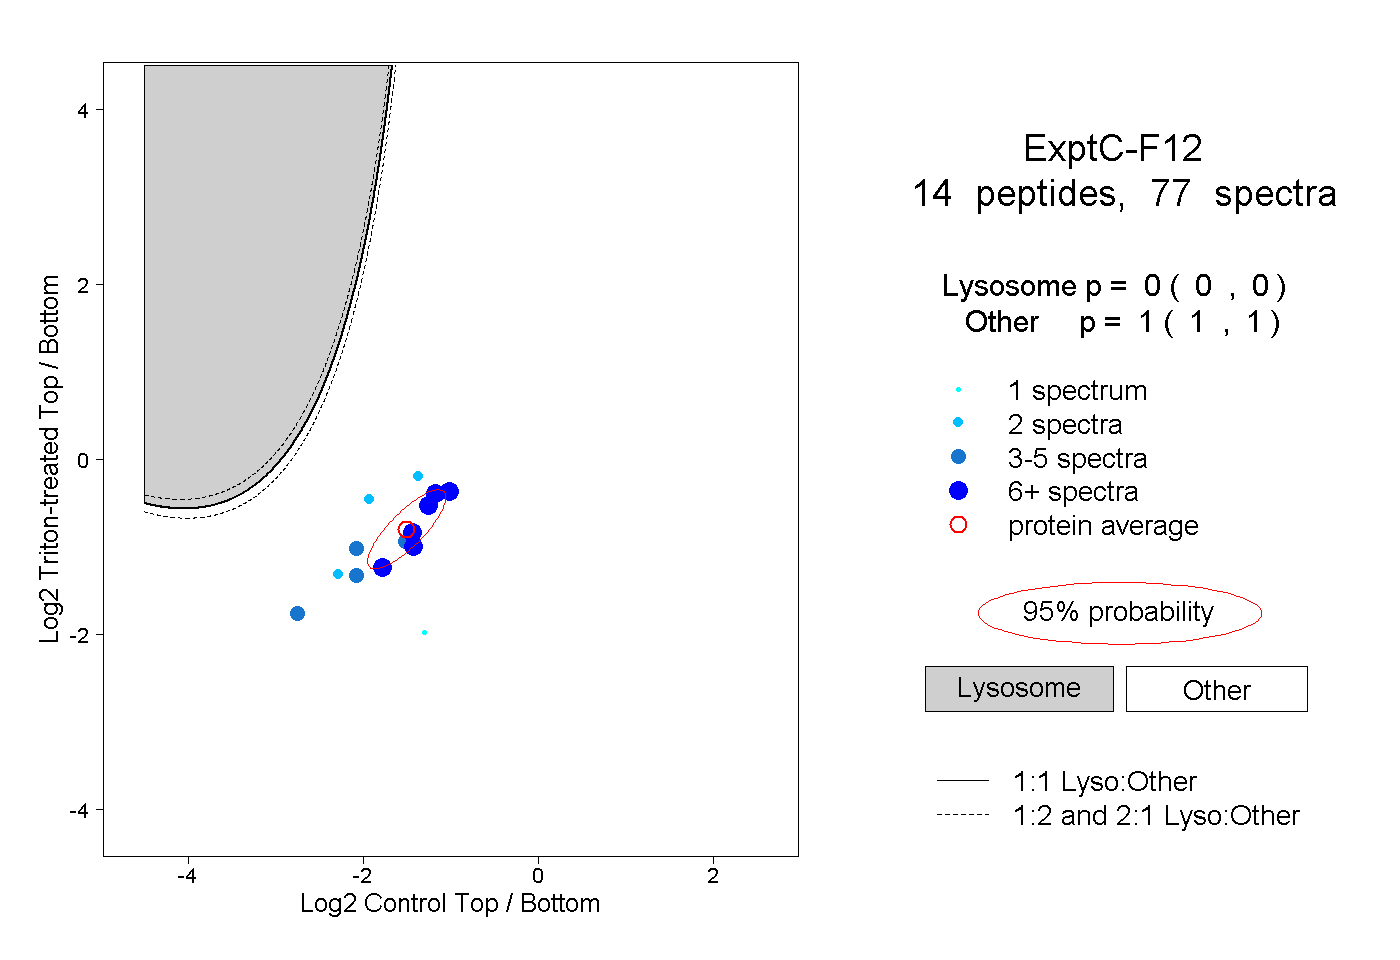 |
0.000 0.000 | 0.000 |
1.000 1.000 | 1.000 |
||||||||
| Plot | Lyso | Other | |||||||||||
| Expt D |
5 peptides |
13 spectra |
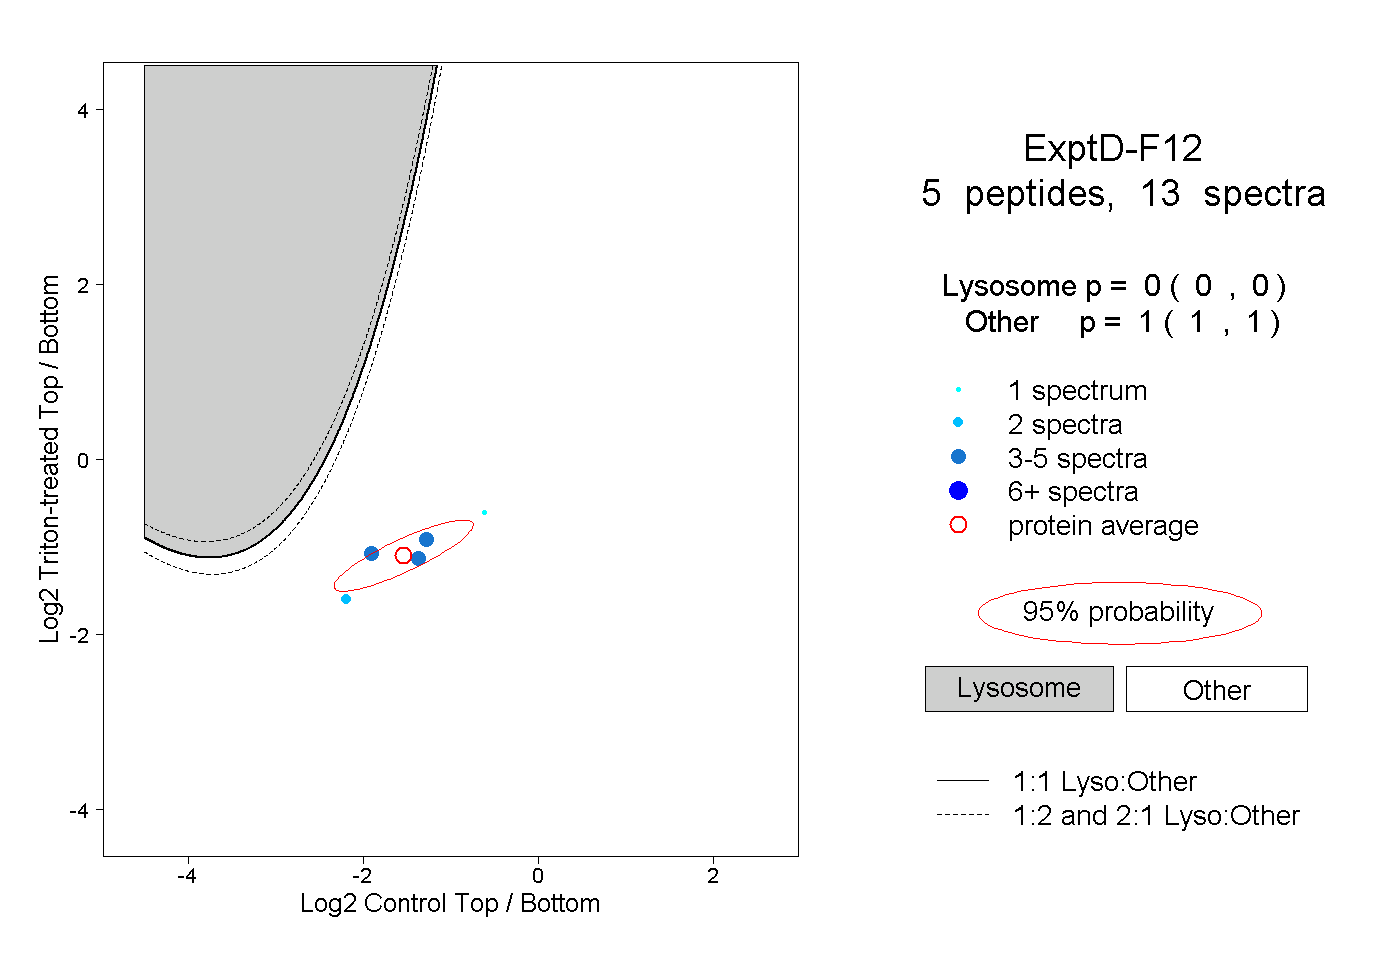 |
0.000 0.000 | 0.000 |
1.000 1.000 | 1.000 |