 6
6peptides
spectra
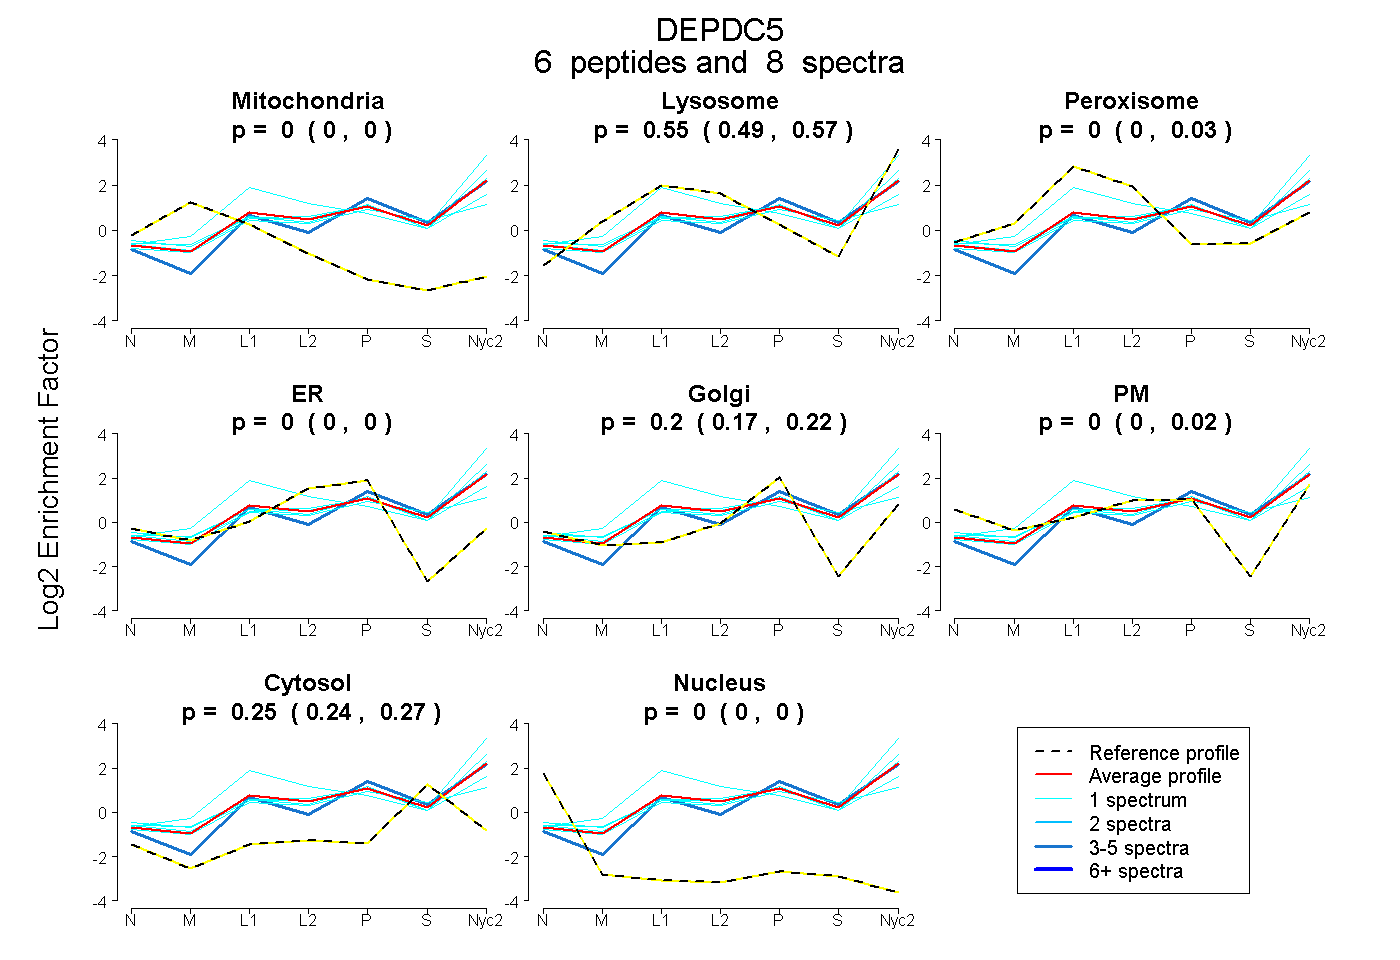
0.000 | 0.000
0.495 | 0.571
0.000 | 0.026
0.000 | 0.000
0.170 | 0.220
0.000 | 0.019
0.236 | 0.270
0.000 | 0.000
1peptide
spectrum
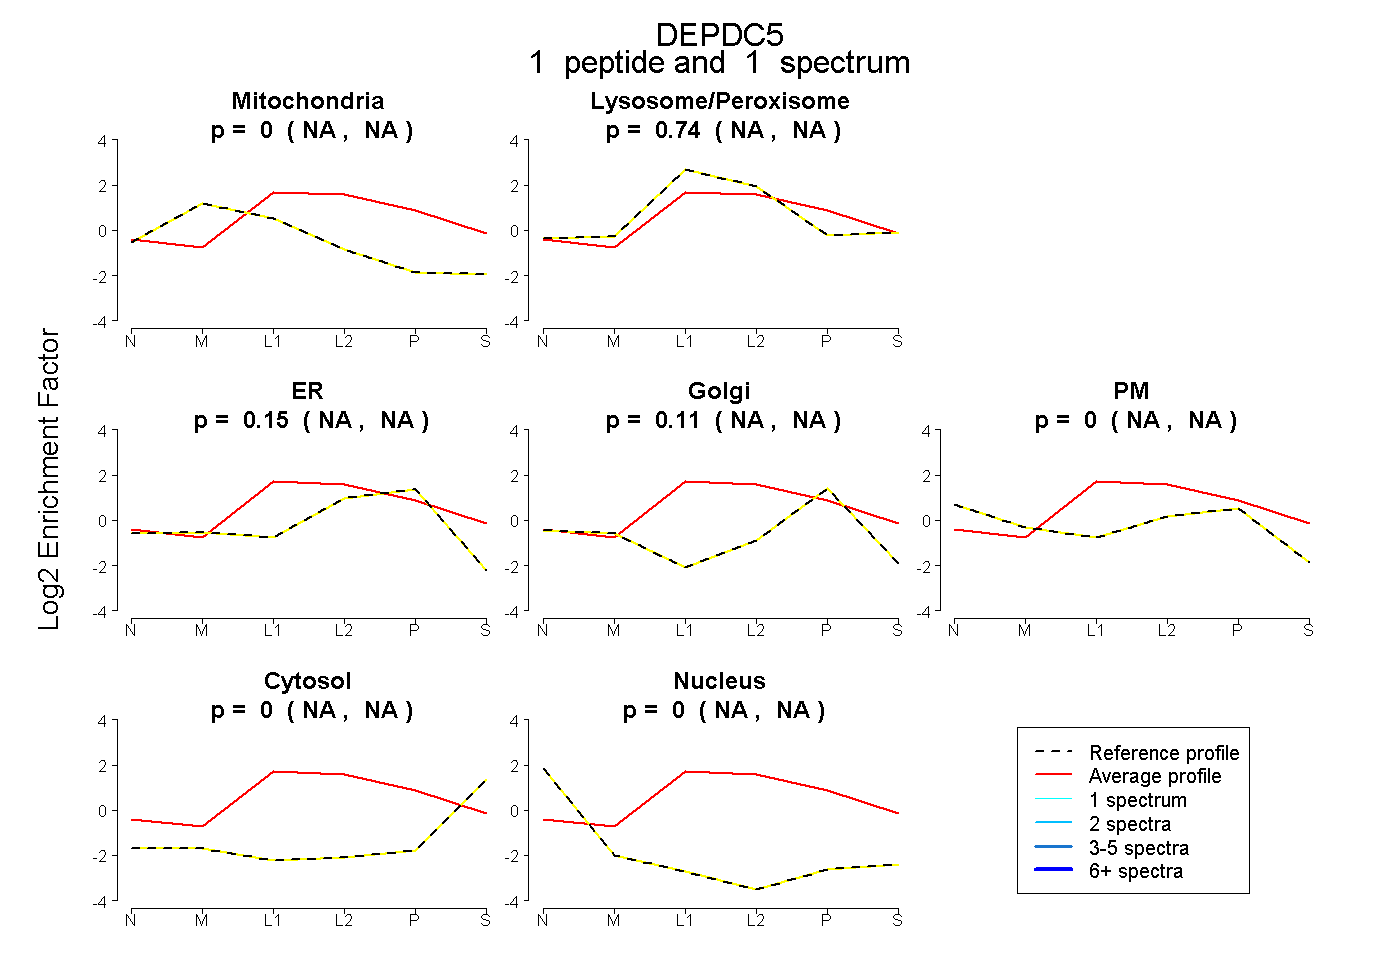
NA | NA
NA | NA
NA | NA
NA | NA
NA | NA
NA | NA
NA | NA
9peptides
spectra
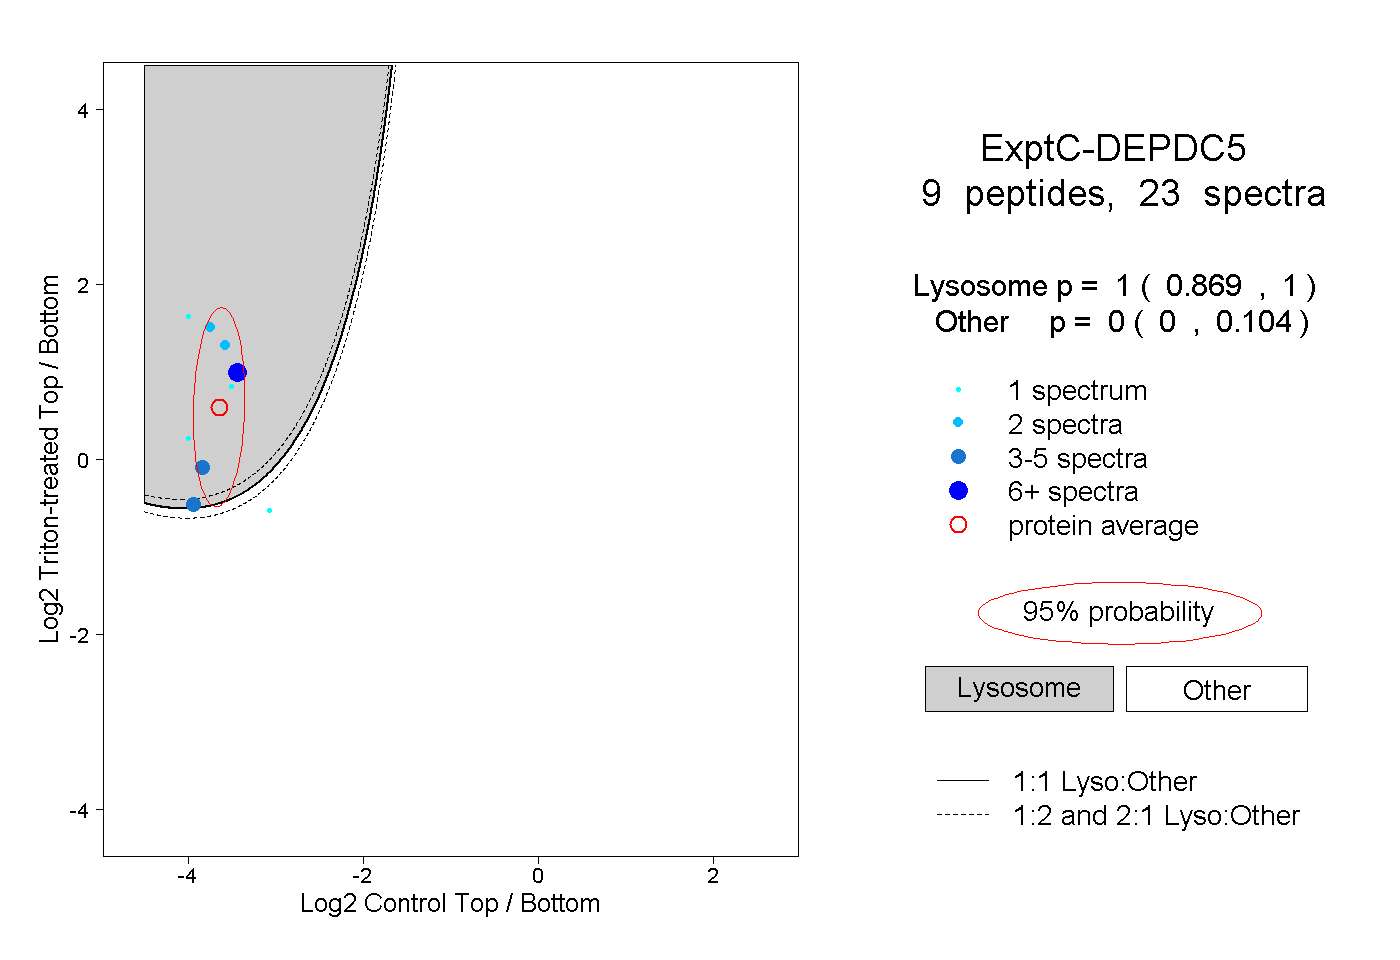
0.869 | 1.000
0.000 | 0.104