 6
6peptides
spectra
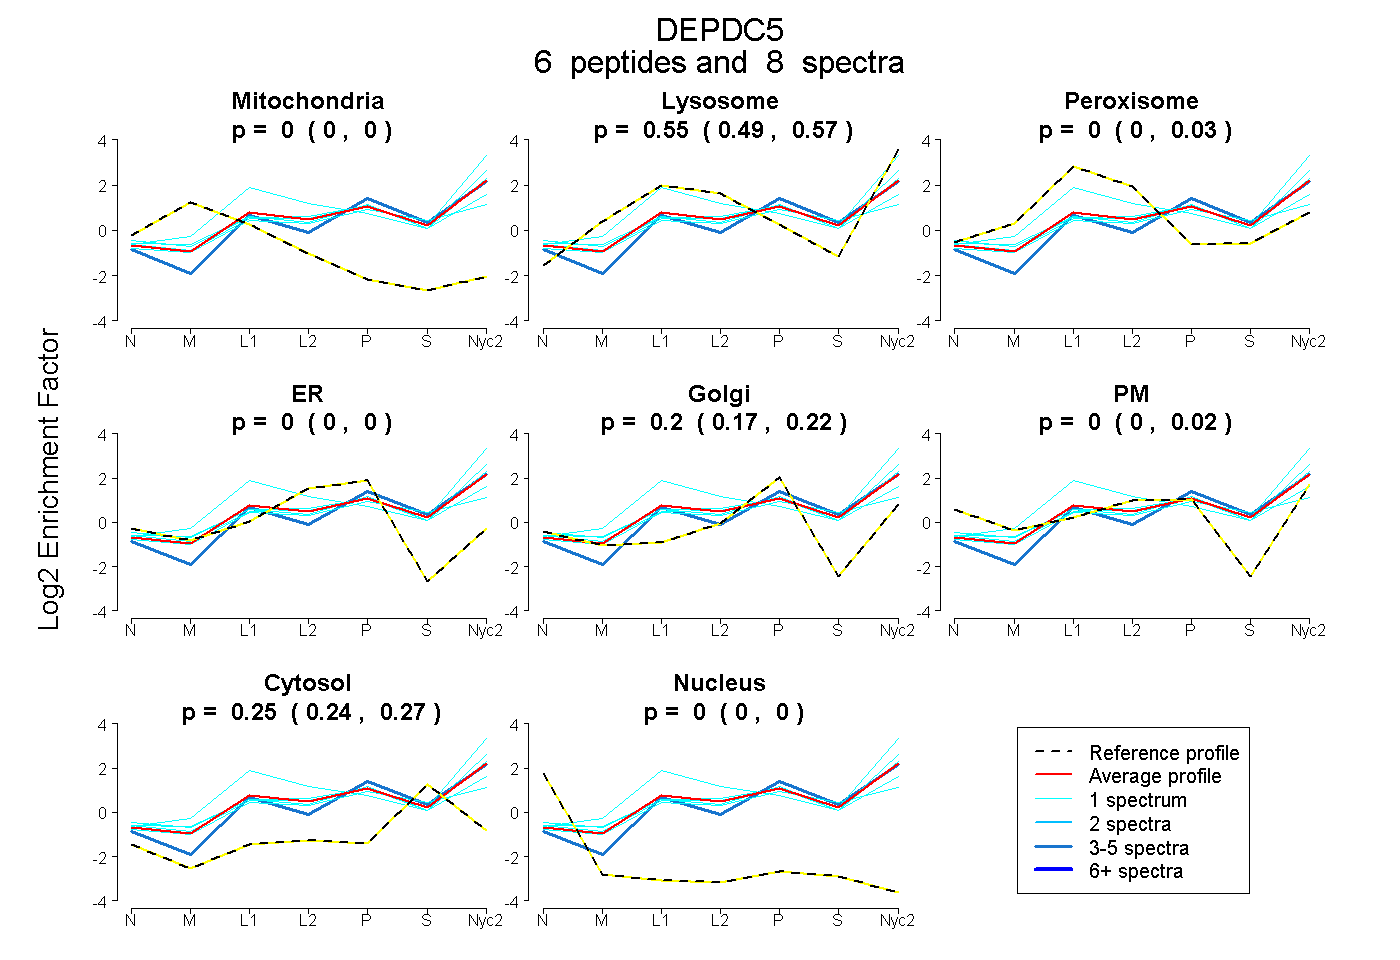
0.000 | 0.000
0.495 | 0.571
0.000 | 0.026
0.000 | 0.000
0.170 | 0.220
0.000 | 0.019
0.236 | 0.270
0.000 | 0.000
| Plot | Mito | Lyso | Perox | ER | Golgi | PM | Cytosol | Nucleus | |||||
| Expt A |
6 peptides |
8 spectra |
|
0.000 0.000 | 0.000 |
0.545 0.495 | 0.571 |
0.000 0.000 | 0.026 |
0.000 0.000 | 0.000 |
0.200 0.170 | 0.220 |
0.000 0.000 | 0.019 |
0.255 0.236 | 0.270 |
0.000 0.000 | 0.000 |
| 1 spectrum, SIDEFPEVNR | 0.000 | 0.531 | 0.000 | 0.000 | 0.250 | 0.000 | 0.219 | 0.000 | ||
| 1 spectrum, LFIQYPVLVR | 0.000 | 0.645 | 0.000 | 0.000 | 0.164 | 0.000 | 0.191 | 0.000 | ||
| 1 spectrum, FLLLPACVTATK | 0.000 | 0.291 | 0.136 | 0.000 | 0.234 | 0.000 | 0.339 | 0.000 | ||
| 1 spectrum, VVVQNER | 0.000 | 0.539 | 0.000 | 0.000 | 0.142 | 0.115 | 0.205 | 0.000 | ||
| 1 spectrum, SQLFCNSFTPR | 0.000 | 0.321 | 0.449 | 0.000 | 0.120 | 0.000 | 0.111 | 0.000 | ||
| 3 spectra, ALINPFAPSR | 0.000 | 0.429 | 0.000 | 0.000 | 0.252 | 0.000 | 0.319 | 0.000 |
| Plot | Mito | Lyso or Perox | ER | Golgi | PM | Cytosol | Nucleus | ||||||
| Expt B |
1 peptide |
1 spectrum |
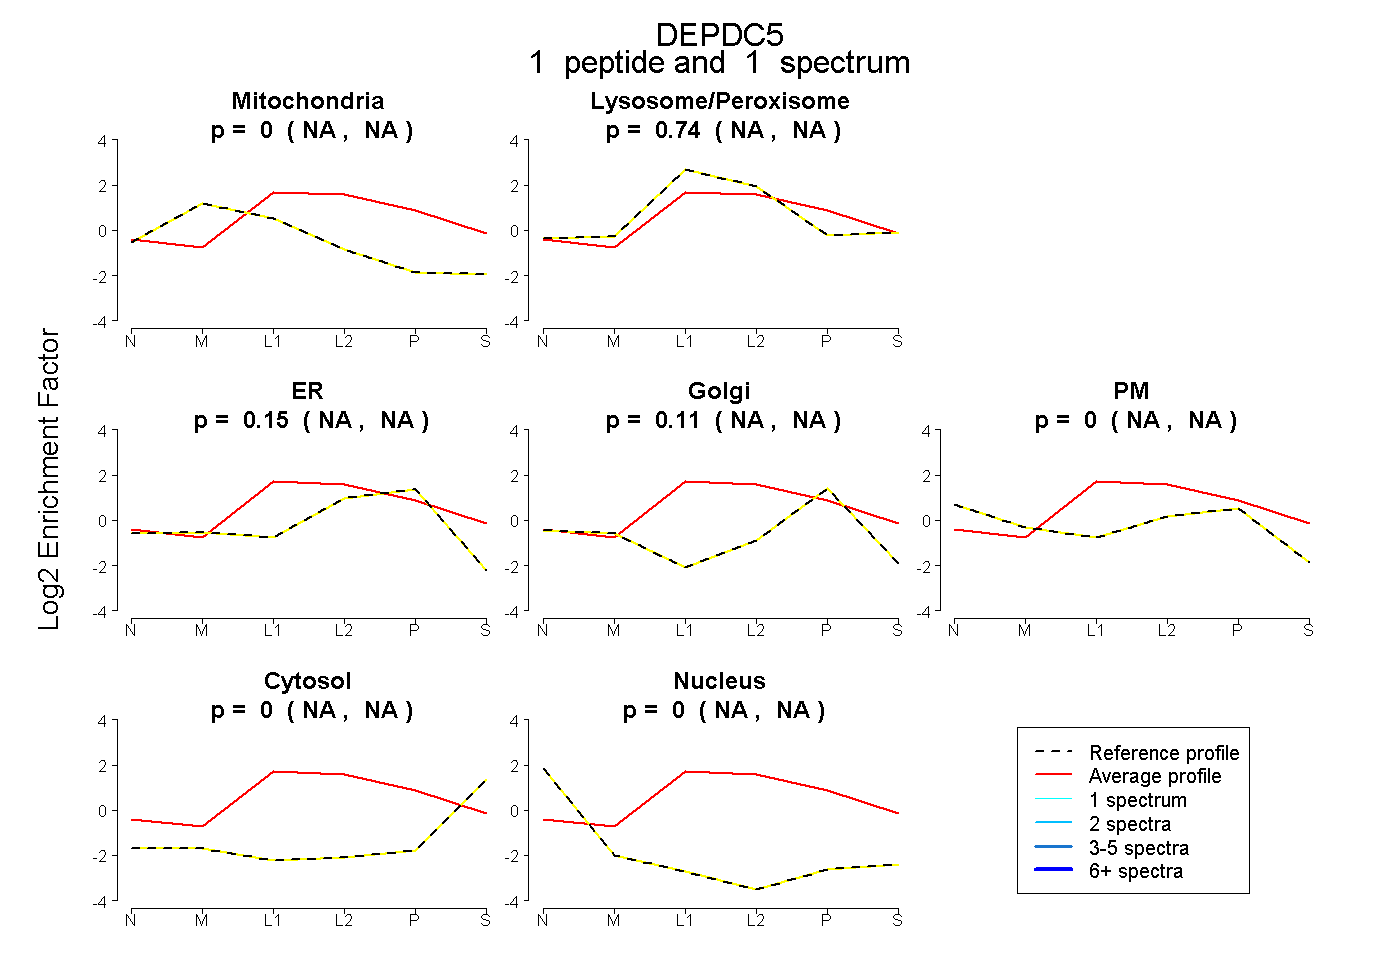 |
0.000 NA | NA |
0.742 NA | NA |
0.152 NA | NA |
0.106 NA | NA |
0.000 NA | NA |
0.000 NA | NA |
0.000 NA | NA |
|||
| Plot | Lyso | Other | |||||||||||
| Expt C |
9 peptides |
23 spectra |
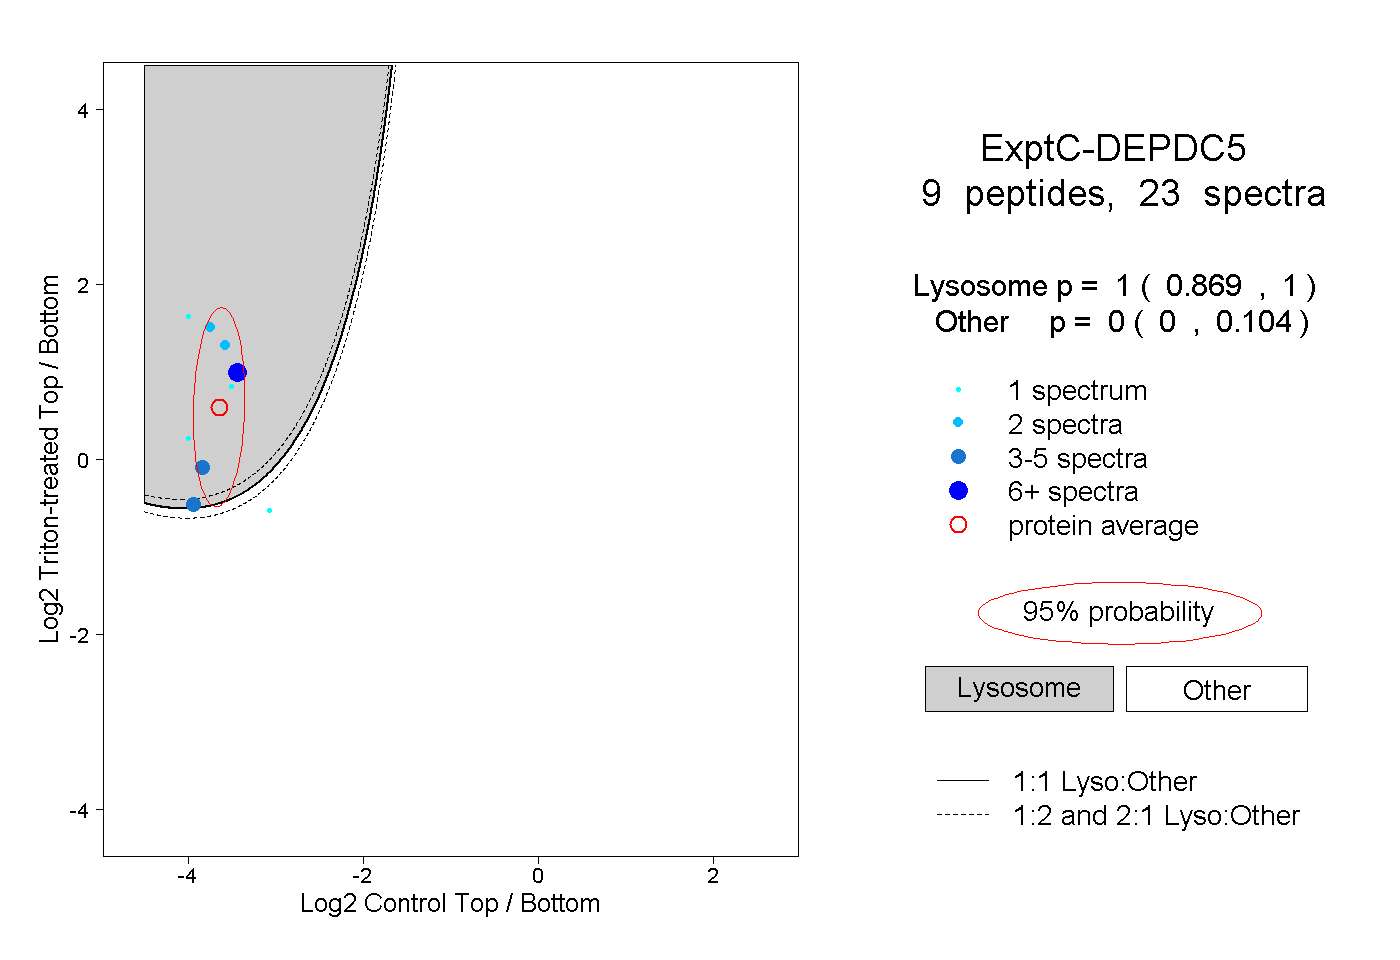 |
1.000 0.869 | 1.000 |
0.000 0.000 | 0.104 |