 8
8peptides
spectra
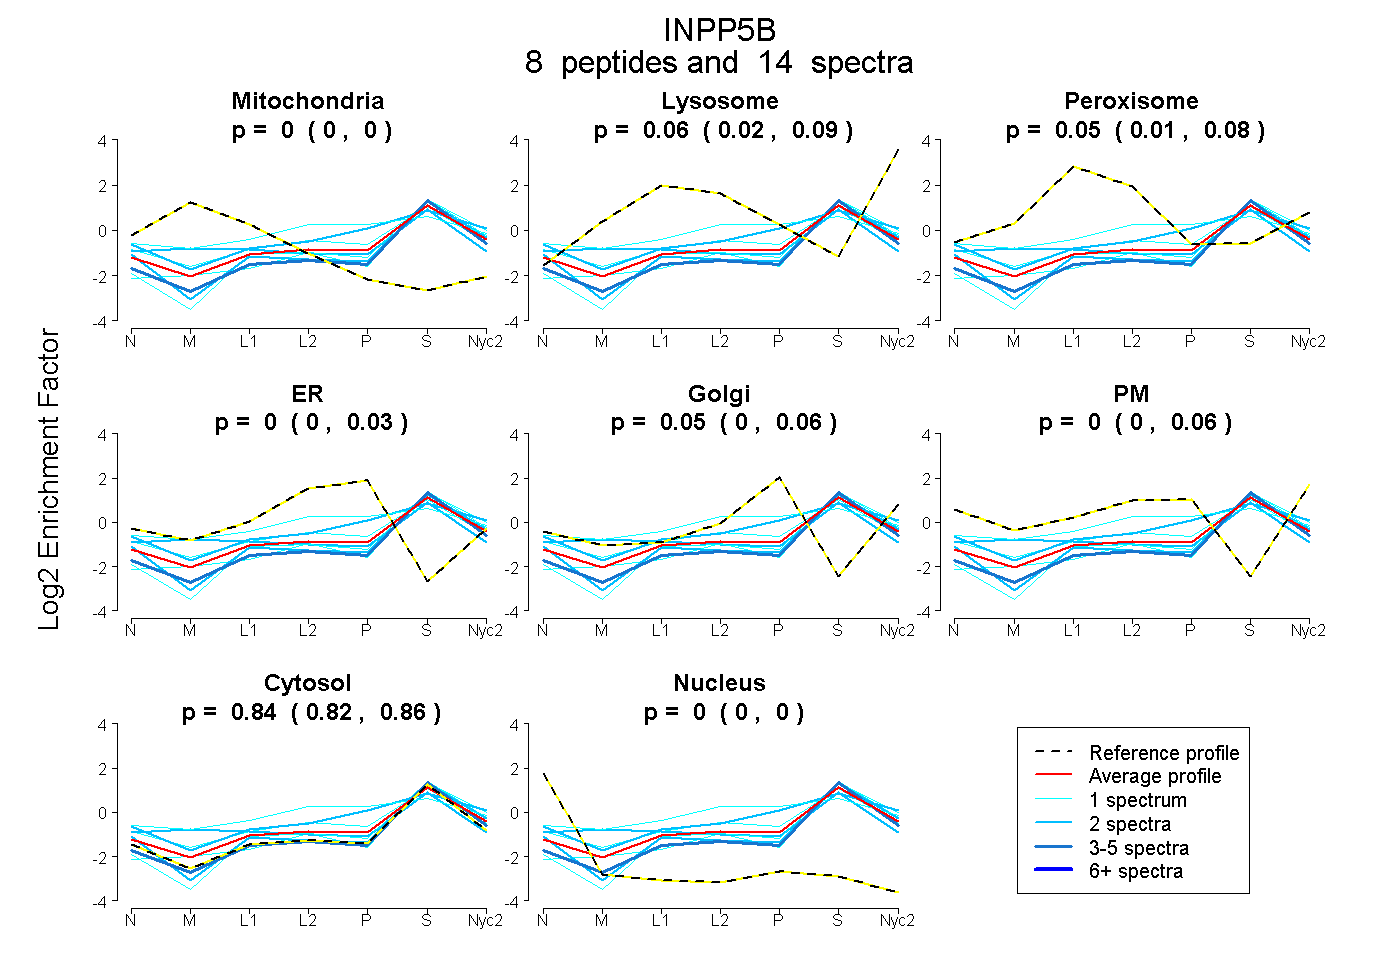
0.000 | 0.000
0.023 | 0.086
0.012 | 0.075
0.000 | 0.028
0.000 | 0.064
0.000 | 0.058
0.824 | 0.864
0.000 | 0.000
1peptide
spectrum
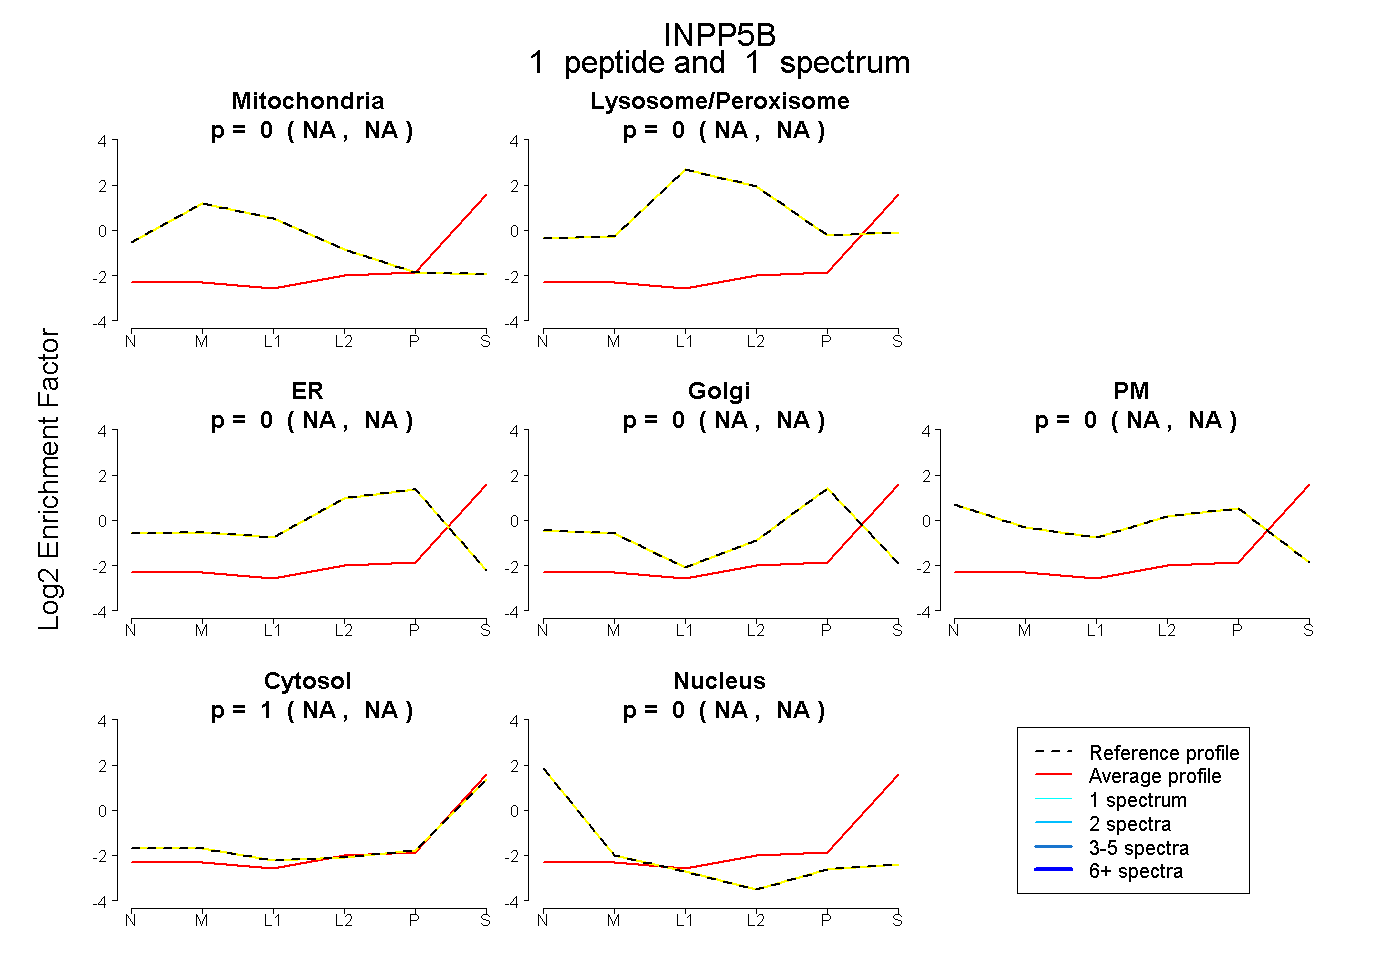
NA | NA
NA | NA
NA | NA
NA | NA
NA | NA
NA | NA
NA | NA
| Plot | Mito | Lyso | Perox | ER | Golgi | PM | Cytosol | Nucleus | |||||
| Expt A |
8 peptides |
14 spectra |
|
0.000 0.000 | 0.000 |
0.057 0.023 | 0.086 |
0.054 0.012 | 0.075 |
0.000 0.000 | 0.028 |
0.047 0.000 | 0.064 |
0.000 0.000 | 0.058 |
0.842 0.824 | 0.864 |
0.000 0.000 | 0.000 |
||
| Plot | Mito | Lyso or Perox | ER | Golgi | PM | Cytosol | Nucleus | ||||||
| Expt B |
1 peptide |
1 spectrum |
|
0.000 NA | NA |
0.000 NA | NA |
0.000 NA | NA |
0.000 NA | NA |
0.000 NA | NA |
1.000 NA | NA |
0.000 NA | NA |