 8
8peptides
spectra
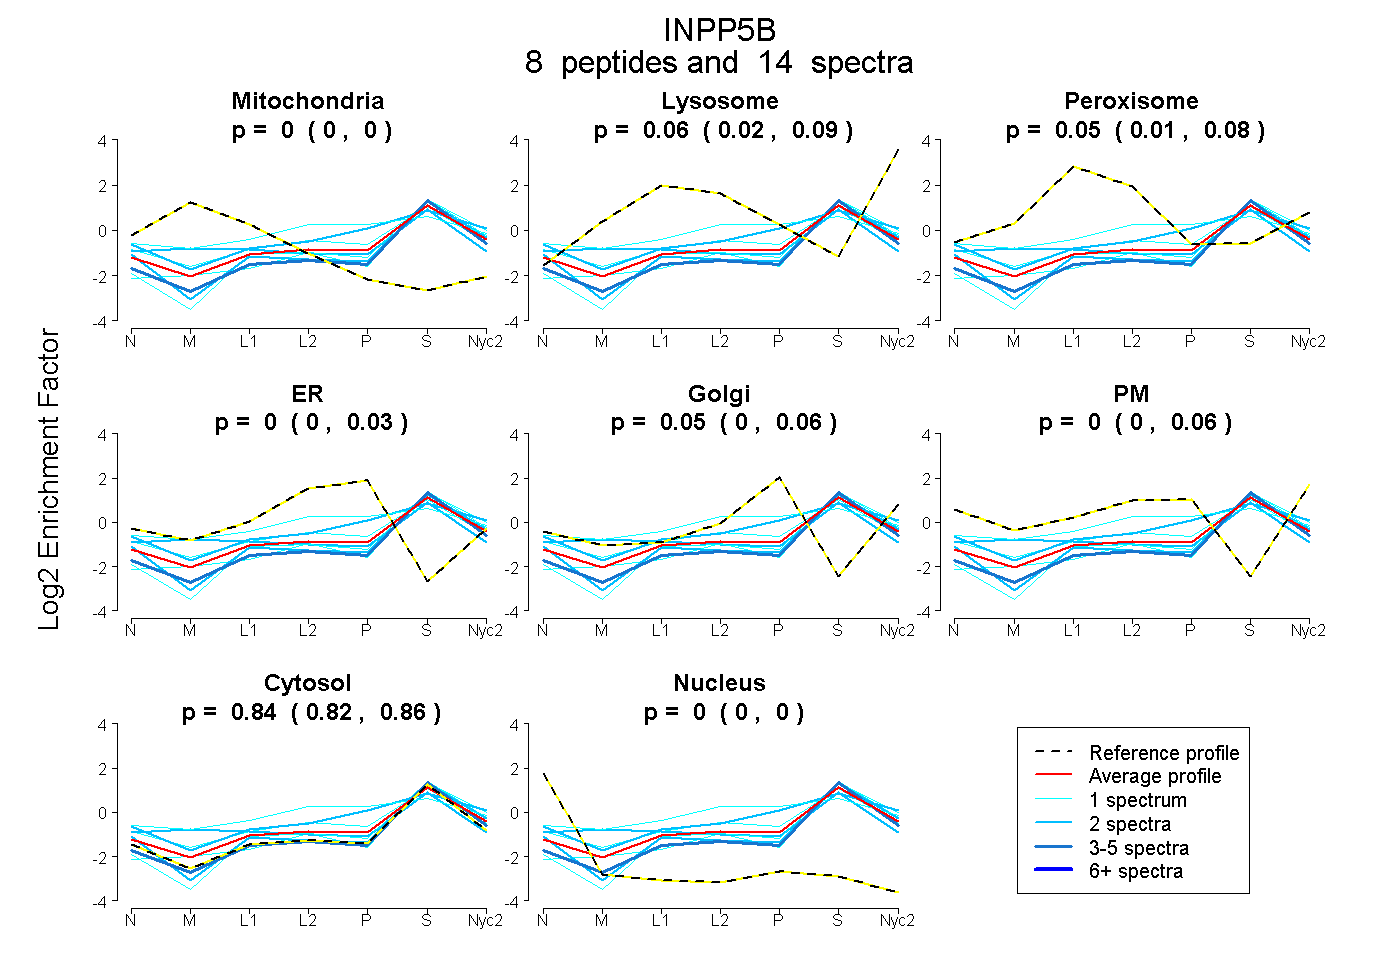
0.000 | 0.000
0.023 | 0.086
0.012 | 0.075
0.000 | 0.028
0.000 | 0.064
0.000 | 0.058
0.824 | 0.864
0.000 | 0.000
| Plot | Mito | Lyso | Perox | ER | Golgi | PM | Cytosol | Nucleus | |||||
| Expt A |
8 peptides |
14 spectra |
|
0.000 0.000 | 0.000 |
0.057 0.023 | 0.086 |
0.054 0.012 | 0.075 |
0.000 0.000 | 0.028 |
0.047 0.000 | 0.064 |
0.000 0.000 | 0.058 |
0.842 0.824 | 0.864 |
0.000 0.000 | 0.000 |
| 1 spectrum, EPILDLPLK | 0.000 | 0.035 | 0.000 | 0.000 | 0.000 | 0.000 | 0.965 | 0.000 | ||
| 1 spectrum, TLEEIVR | 0.000 | 0.000 | 0.269 | 0.094 | 0.162 | 0.000 | 0.474 | 0.000 | ||
| 2 spectra, QWLTAKPSR | 0.000 | 0.046 | 0.062 | 0.000 | 0.160 | 0.088 | 0.644 | 0.000 | ||
| 1 spectrum, ECLRPWLSSDTK | 0.000 | 0.000 | 0.137 | 0.067 | 0.000 | 0.047 | 0.749 | 0.000 | ||
| 2 spectra, GLLPLDQSSGAR | 0.000 | 0.028 | 0.000 | 0.000 | 0.000 | 0.004 | 0.968 | 0.000 | ||
| 4 spectra, IEELDVEK | 0.000 | 0.000 | 0.000 | 0.000 | 0.000 | 0.000 | 1.000 | 0.000 | ||
| 2 spectra, EFCFENVK | 0.188 | 0.000 | 0.111 | 0.000 | 0.000 | 0.000 | 0.700 | 0.000 | ||
| 1 spectrum, EEEWFK | 0.000 | 0.085 | 0.000 | 0.000 | 0.000 | 0.000 | 0.915 | 0.000 |
| Plot | Mito | Lyso or Perox | ER | Golgi | PM | Cytosol | Nucleus | ||||||
| Expt B |
1 peptide |
1 spectrum |
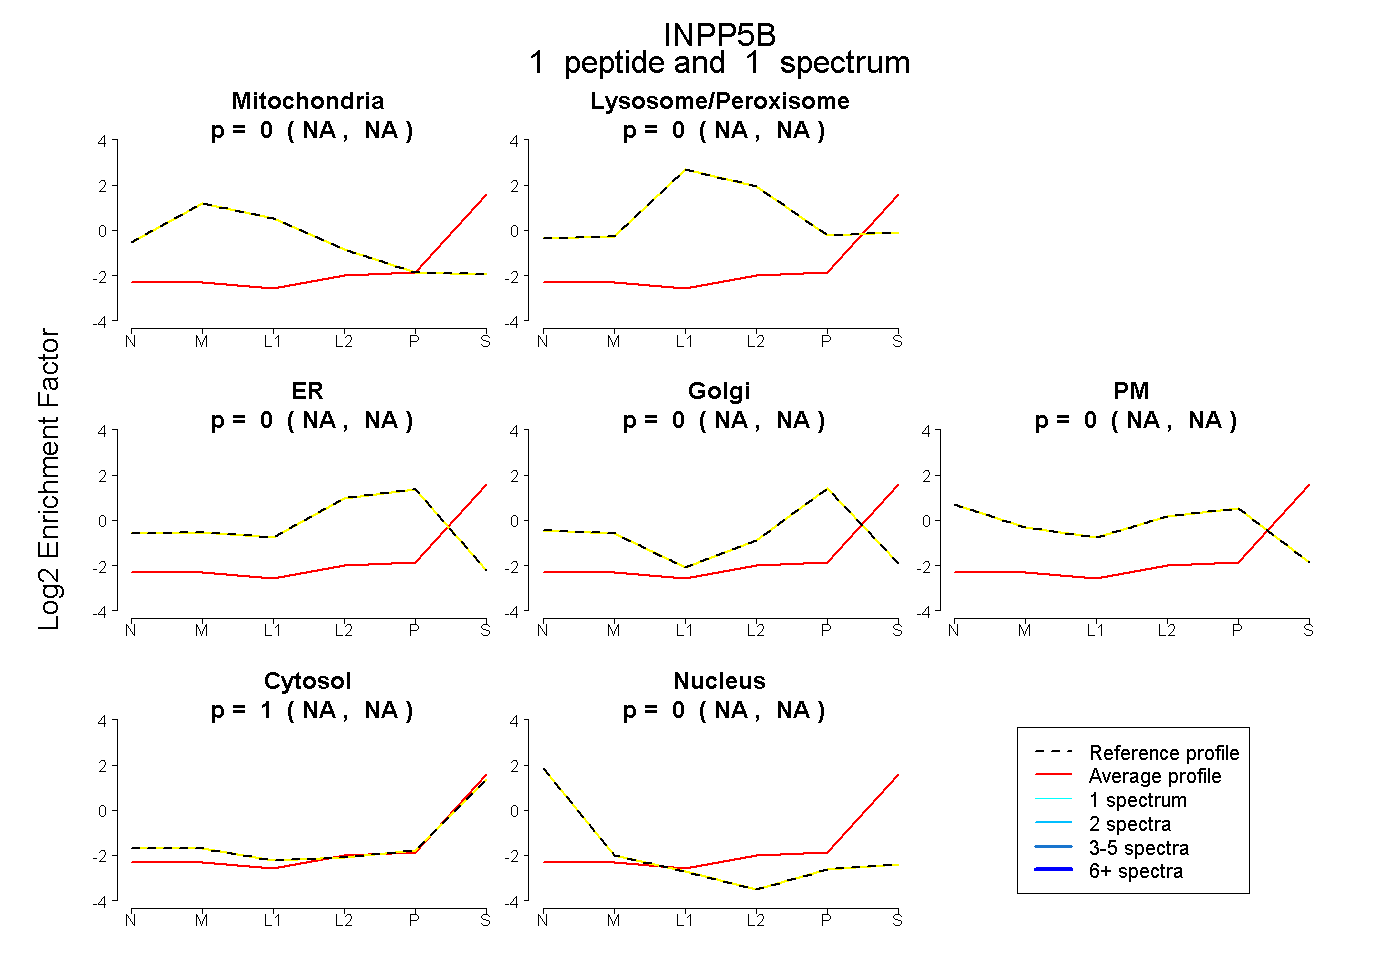 |
0.000 NA | NA |
0.000 NA | NA |
0.000 NA | NA |
0.000 NA | NA |
0.000 NA | NA |
1.000 NA | NA |
0.000 NA | NA |