 11
11peptides
spectra
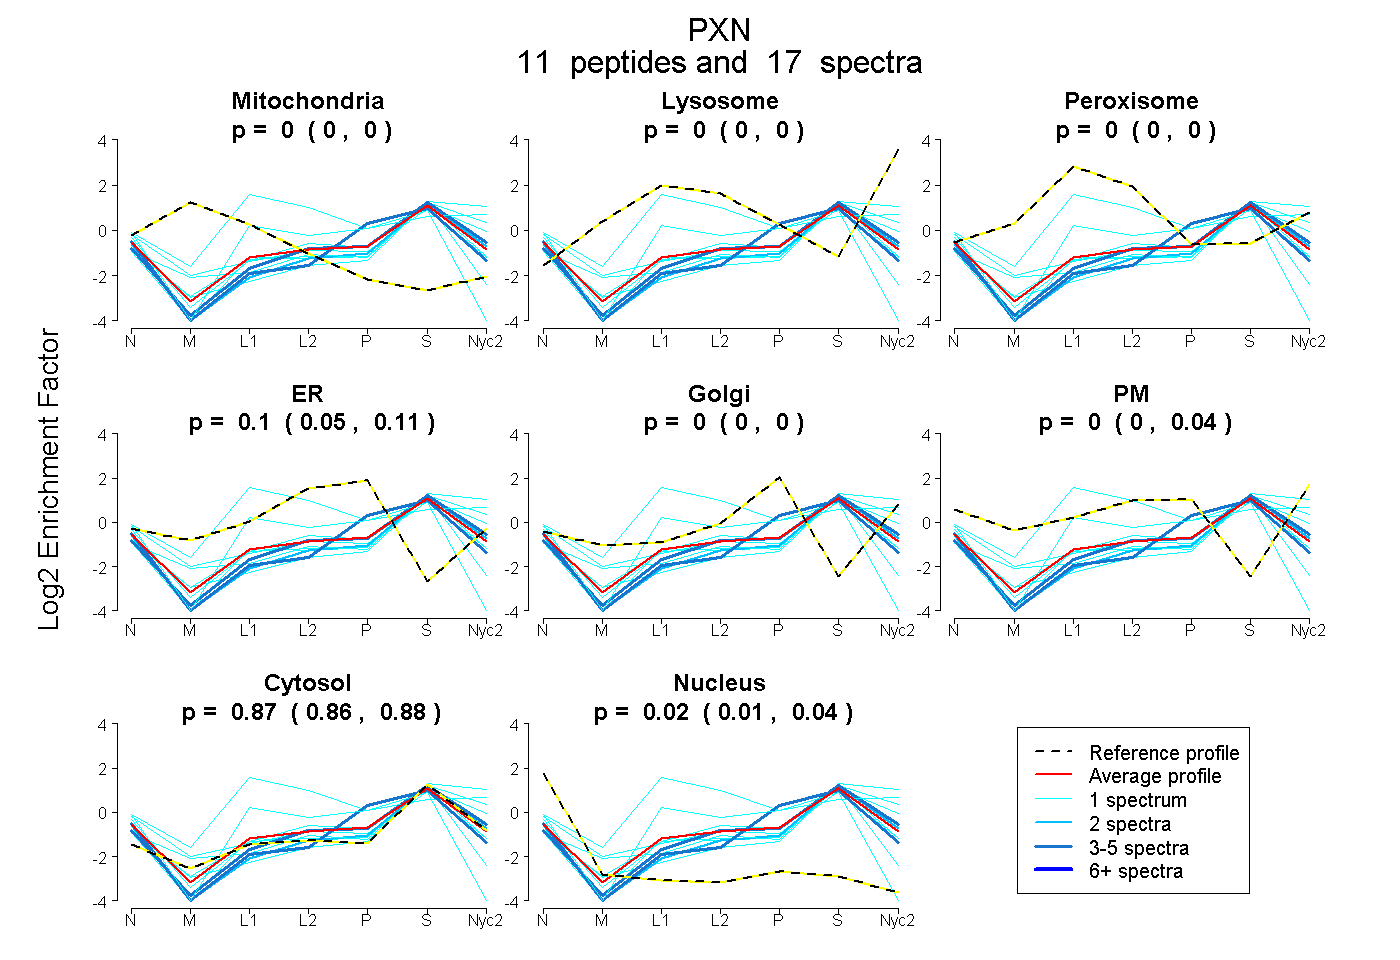
0.000 | 0.000
0.000 | 0.000
0.000 | 0.000
0.051 | 0.114
0.000 | 0.005
0.000 | 0.036
0.858 | 0.880
0.007 | 0.039
3peptides
spectra
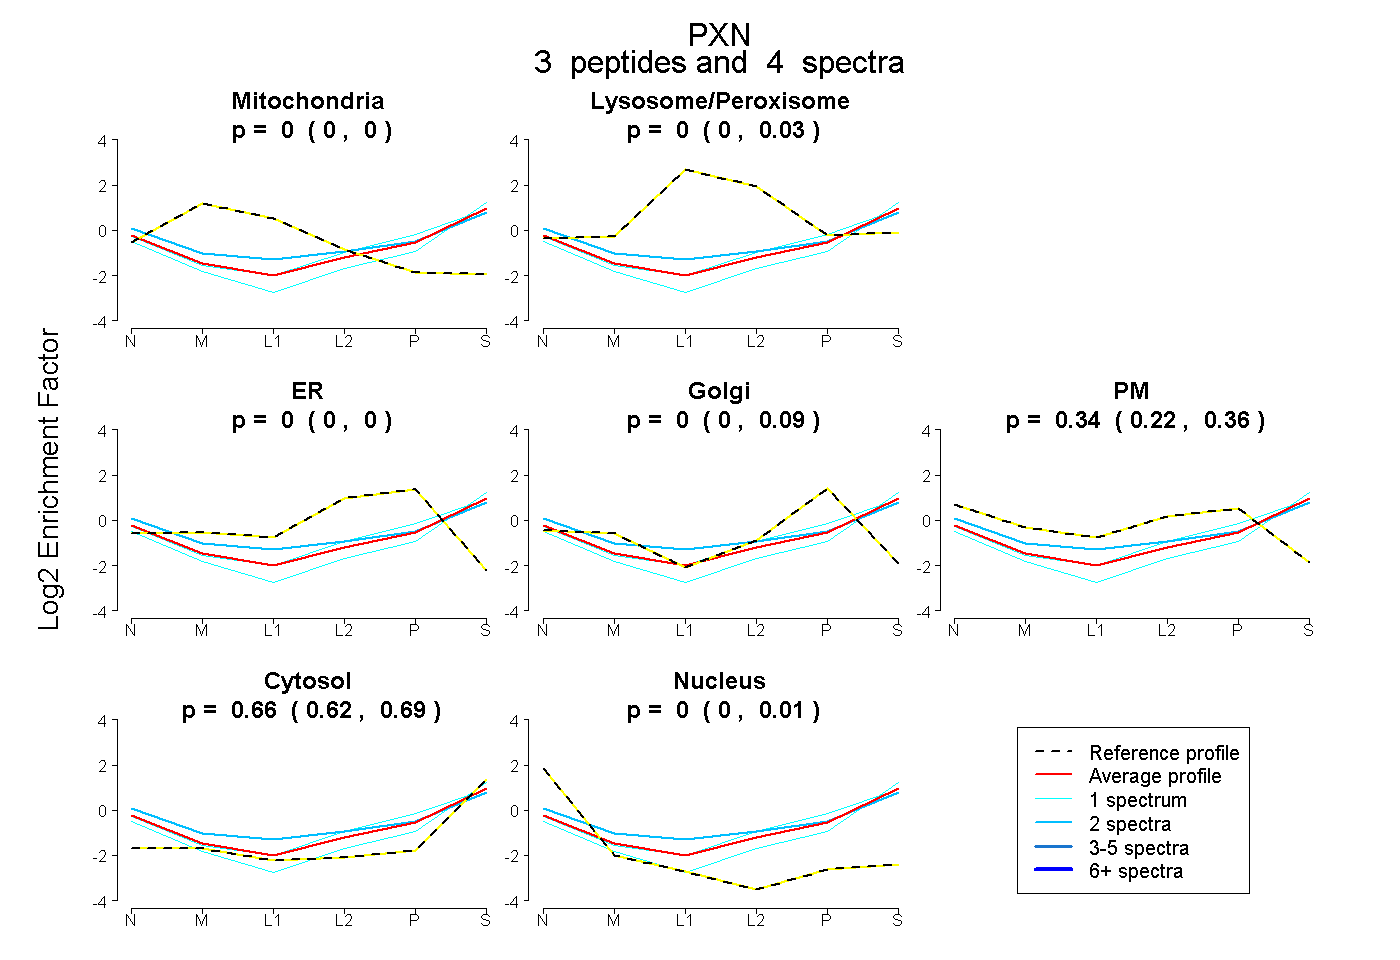
0.000 | 0.000
0.000 | 0.034
0.000 | 0.000
0.000 | 0.095
0.217 | 0.358
0.623 | 0.689
0.000 | 0.014
5peptides
spectra
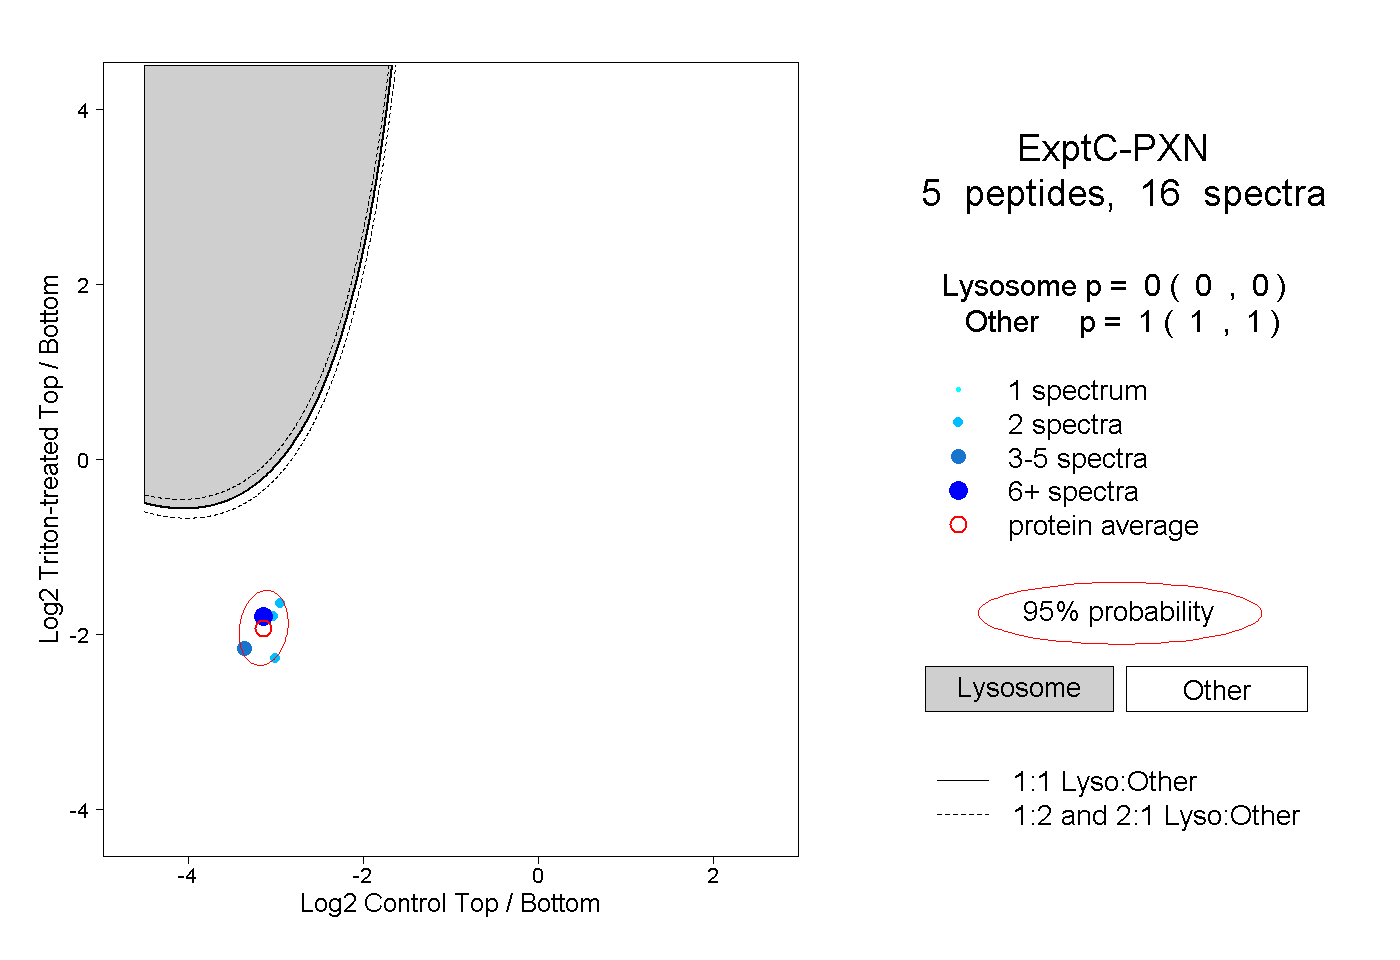
0.000 | 0.000
1.000 | 1.000