 11
11peptides
spectra
0.000 | 0.000
0.000 | 0.000
0.000 | 0.000
0.051 | 0.114
0.000 | 0.005
0.000 | 0.036
0.858 | 0.880
0.007 | 0.039
| Plot | Mito | Lyso | Perox | ER | Golgi | PM | Cytosol | Nucleus | |||||
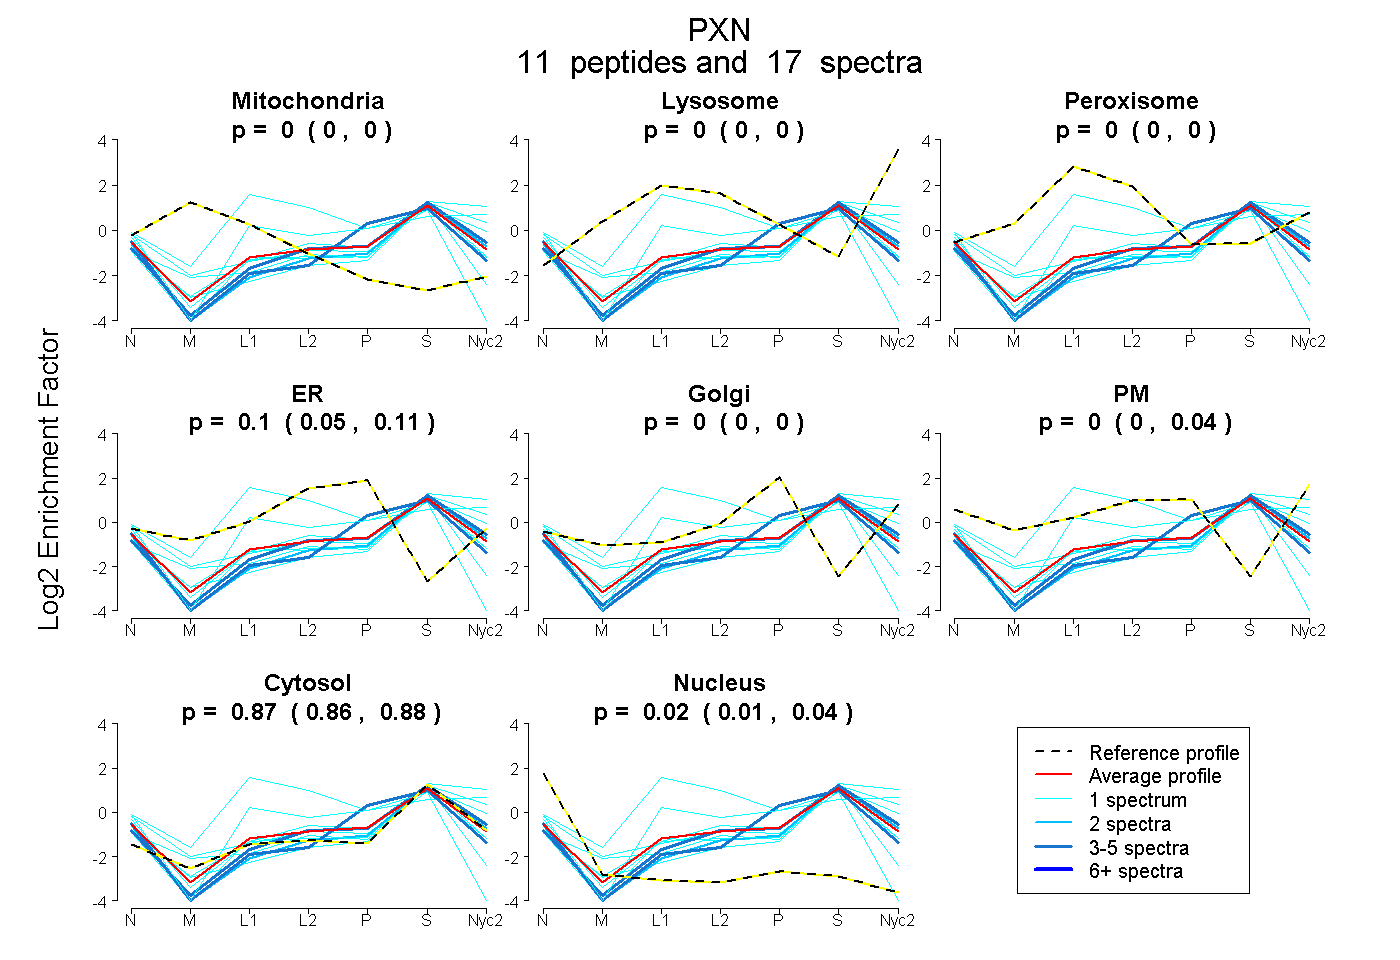
| Expt A |
11 peptides |
17 spectra |
|
0.000 0.000 | 0.000 |
0.000 0.000 | 0.000 |
0.000 0.000 | 0.000 |
0.105 0.051 | 0.114 |
0.000 0.000 | 0.005 |
0.000 0.000 | 0.036 |
0.871 0.858 | 0.880 |
0.024 0.007 | 0.039 |
| 1 spectrum, TWHPEHFVCTHCQEEIGSR | 0.000 | 0.000 | 0.571 | 0.000 | 0.000 | 0.111 | 0.318 | 0.000 | ||
| 4 spectra, LLLELNAVQR | 0.000 | 0.000 | 0.000 | 0.000 | 0.064 | 0.000 | 0.936 | 0.000 | ||
| 1 spectrum, GSLCSGCQKPITGR | 0.000 | 0.000 | 0.000 | 0.000 | 0.000 | 0.000 | 0.804 | 0.196 | ||
| 2 spectra, ISASSATR | 0.000 | 0.000 | 0.000 | 0.000 | 0.000 | 0.000 | 0.921 | 0.079 | ||
| 1 spectrum, DYFDMFAPK | 0.000 | 0.055 | 0.000 | 0.000 | 0.000 | 0.051 | 0.894 | 0.000 | ||
| 1 spectrum, ELDELMASLSDFK | 0.000 | 0.000 | 0.000 | 0.000 | 0.000 | 0.147 | 0.853 | 0.000 | ||
| 1 spectrum, FMAQGK | 0.000 | 0.090 | 0.000 | 0.000 | 0.000 | 0.000 | 0.910 | 0.000 | ||
| 1 spectrum, YAHQQPPSPSPIYSSSTK | 0.000 | 0.000 | 0.000 | 0.196 | 0.000 | 0.000 | 0.636 | 0.168 | ||
| 3 spectra, VTSSQQQTR | 0.000 | 0.000 | 0.000 | 0.000 | 0.104 | 0.000 | 0.791 | 0.105 | ||
| 1 spectrum, KPIAGQVVTAMGK | 0.003 | 0.000 | 0.000 | 0.036 | 0.000 | 0.000 | 0.904 | 0.057 | ||
| 1 spectrum, GVCGACK | 0.000 | 0.000 | 0.064 | 0.062 | 0.000 | 0.019 | 0.745 | 0.111 |
| Plot | Mito | Lyso or Perox | ER | Golgi | PM | Cytosol | Nucleus | ||||||
| Expt B |
3 peptides |
4 spectra |
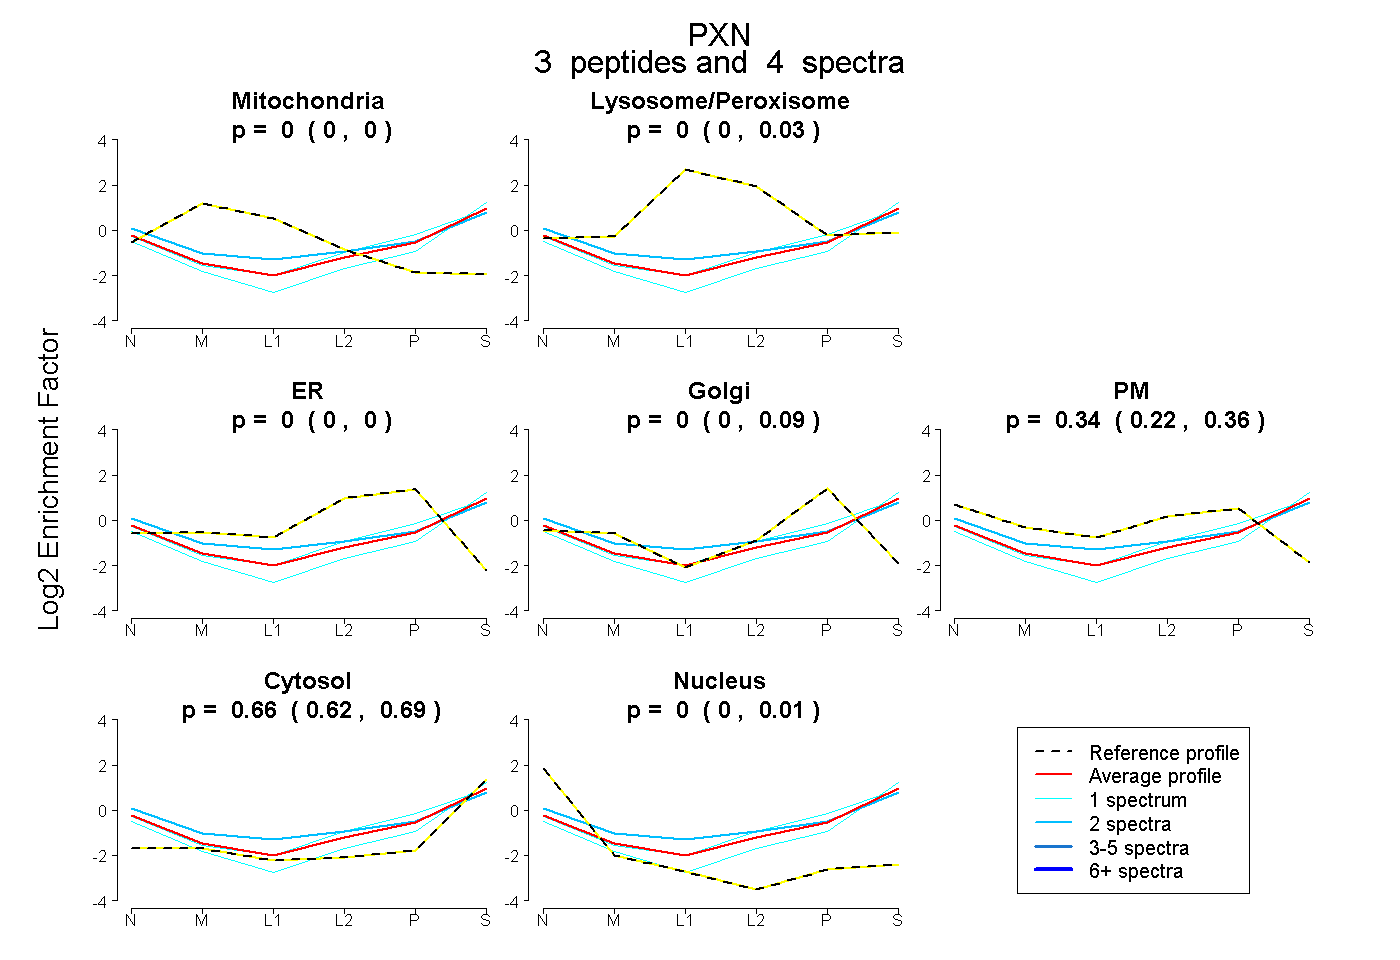 |
0.000 0.000 | 0.000 |
0.000 0.000 | 0.034 |
0.000 0.000 | 0.000 |
0.000 0.000 | 0.095 |
0.335 0.217 | 0.358 |
0.665 0.623 | 0.689 |
0.000 0.000 | 0.014 |
|||
| Plot | Lyso | Other | |||||||||||
| Expt C |
5 peptides |
16 spectra |
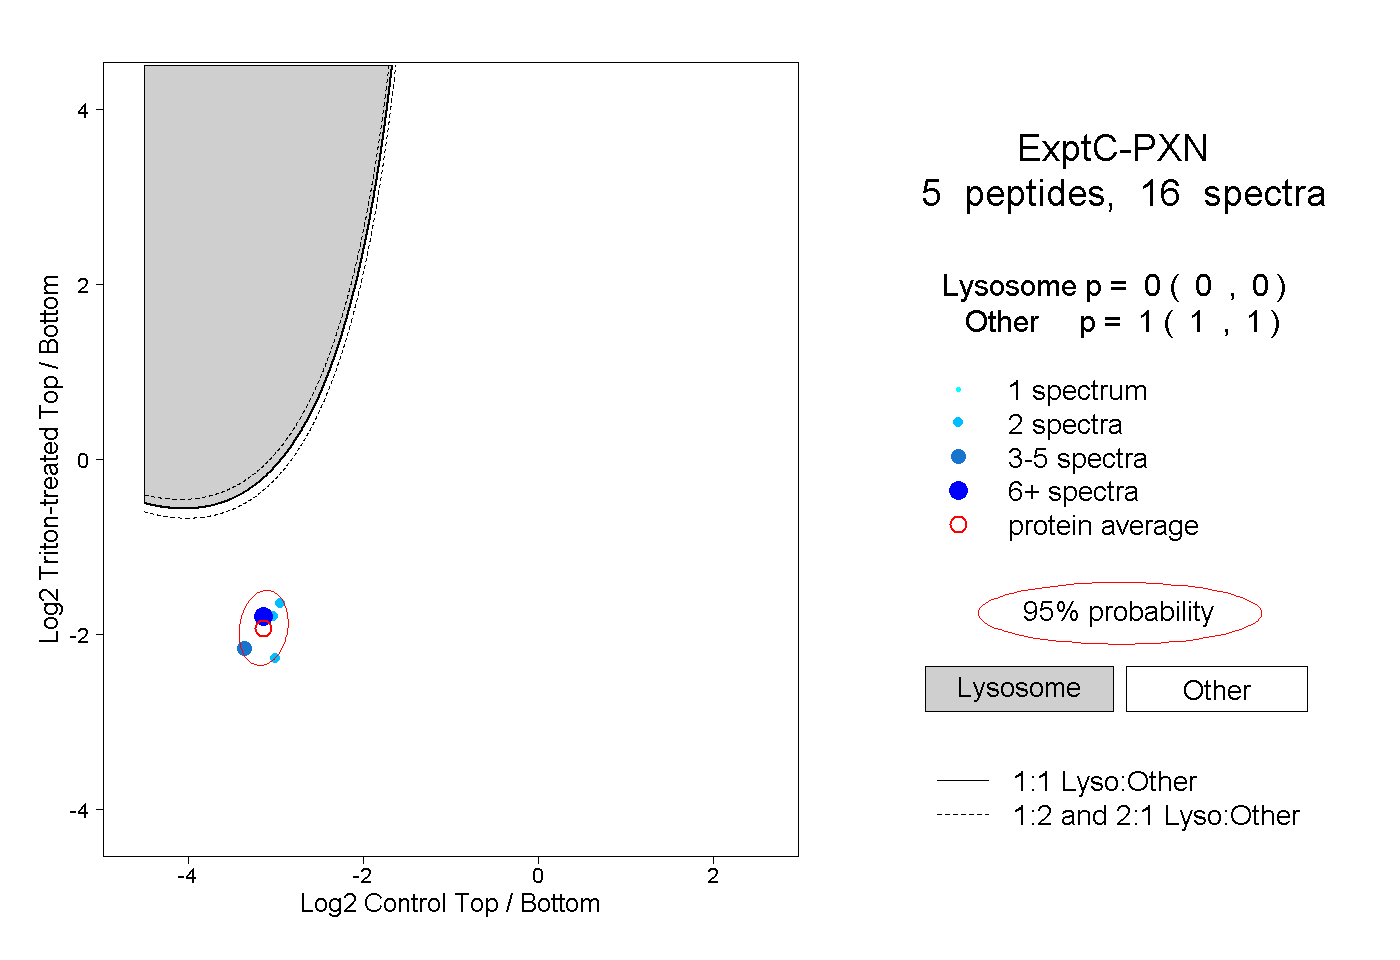 |
0.000 0.000 | 0.000 |
1.000 1.000 | 1.000 |