 30
30peptides
spectra
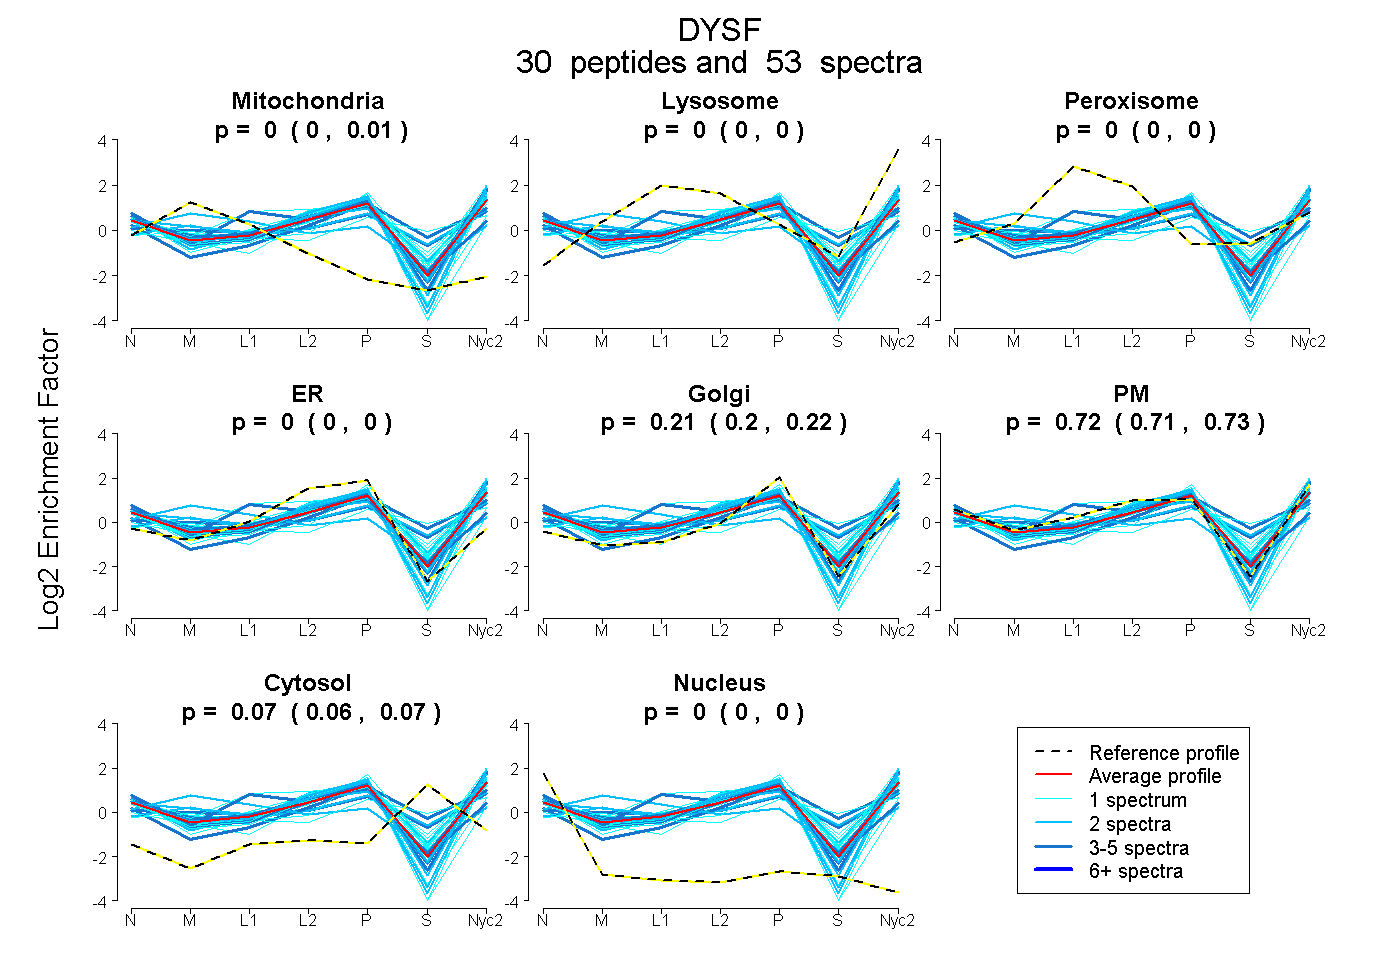
0.000 | 0.008
0.000 | 0.000
0.000 | 0.000
0.000 | 0.000
0.197 | 0.217
0.712 | 0.729
0.057 | 0.073
0.000 | 0.002
4peptides
spectra
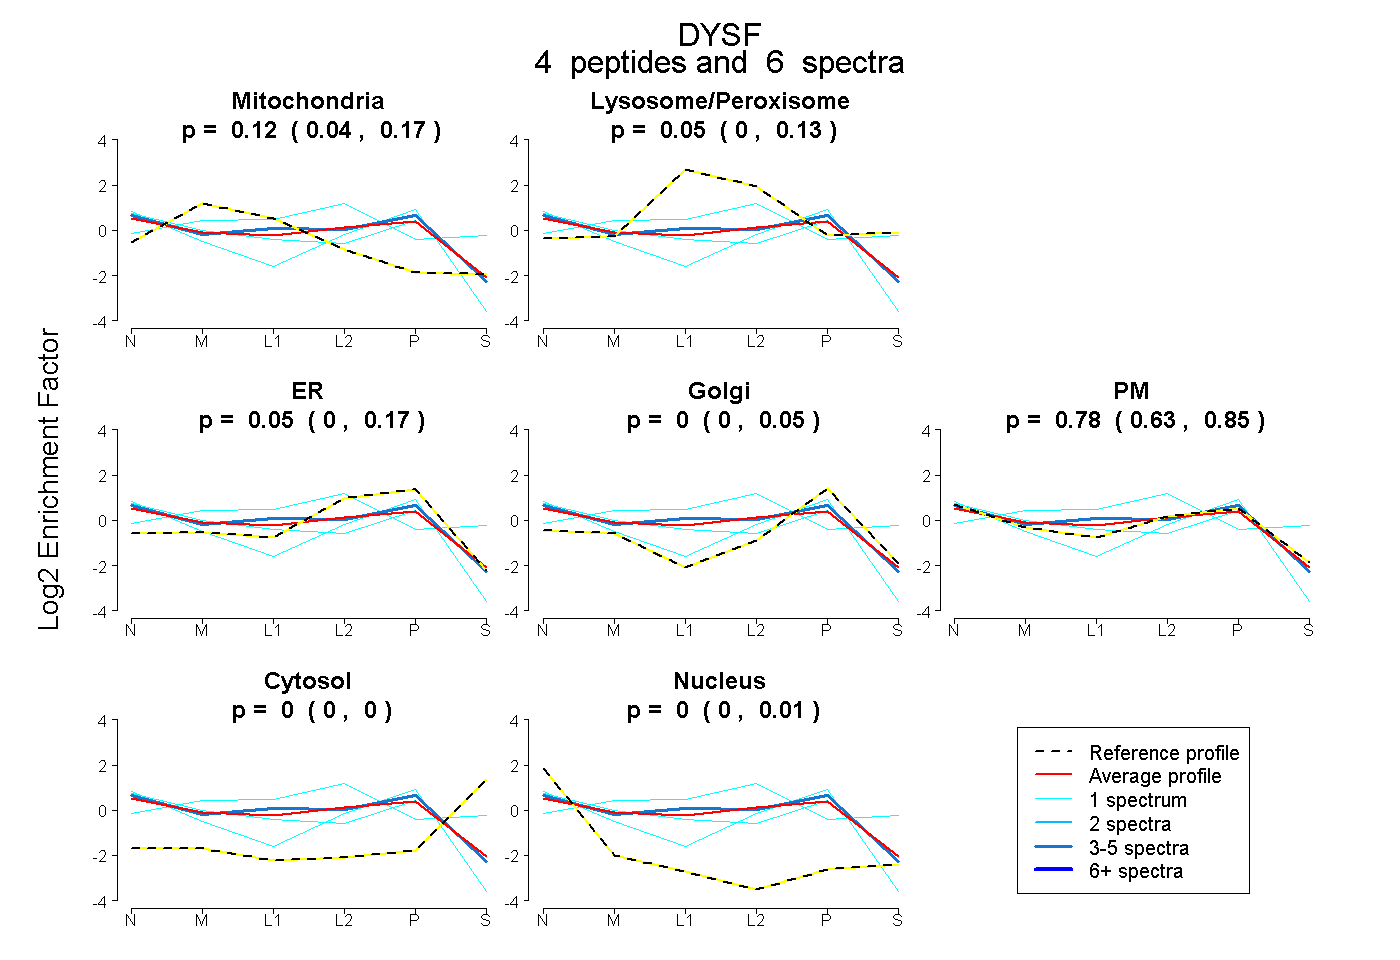
0.043 | 0.172
0.000 | 0.134
0.000 | 0.170
0.000 | 0.054
0.631 | 0.847
0.000 | 0.000
0.000 | 0.007
26peptides
spectra
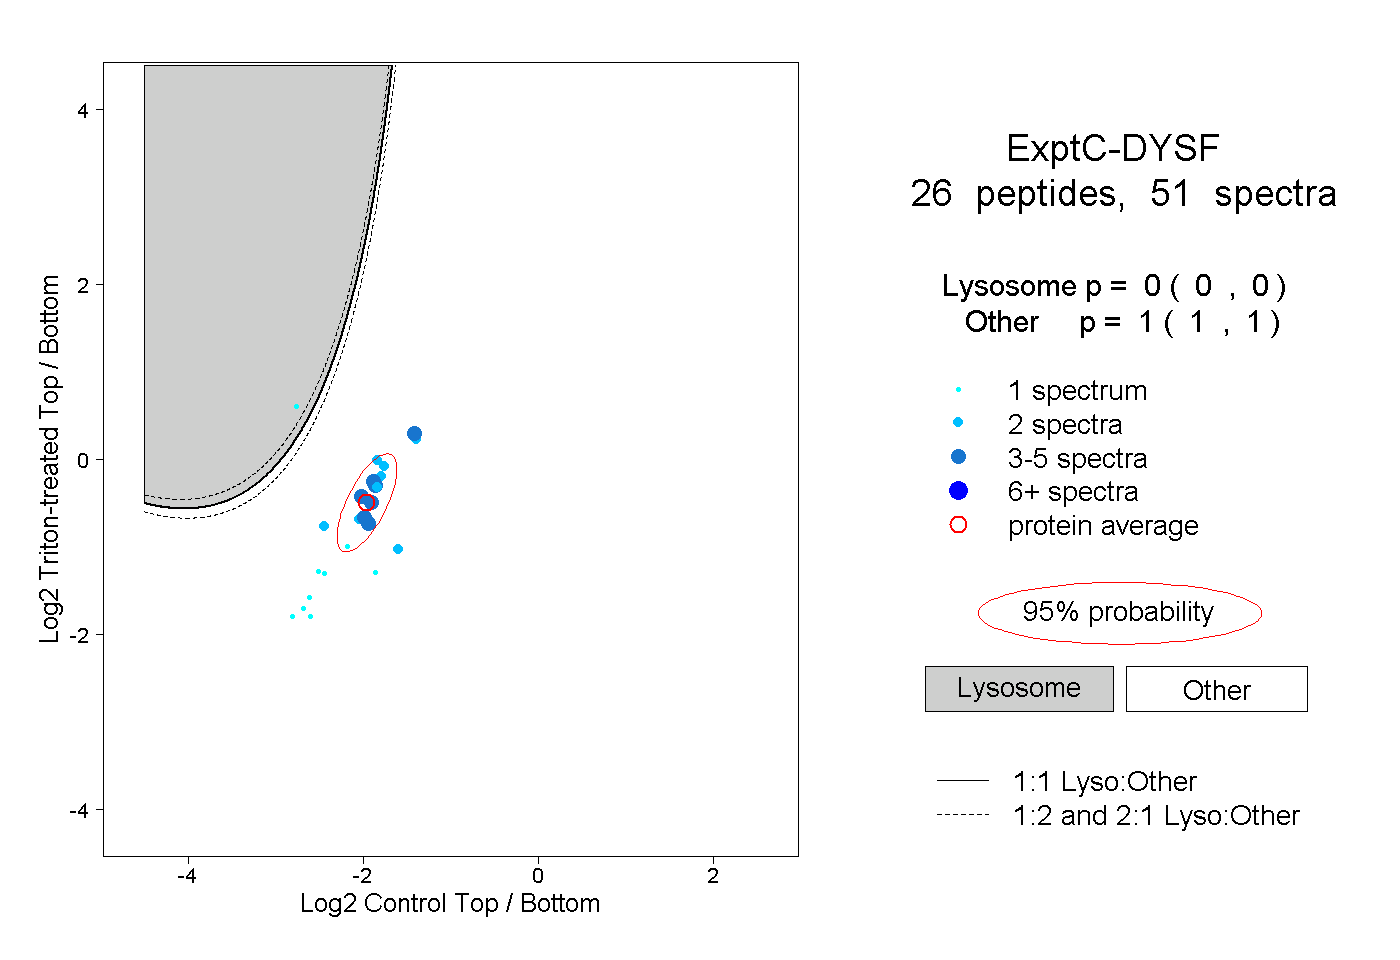
0.000 | 0.000
1.000 | 1.000
4peptides
spectra
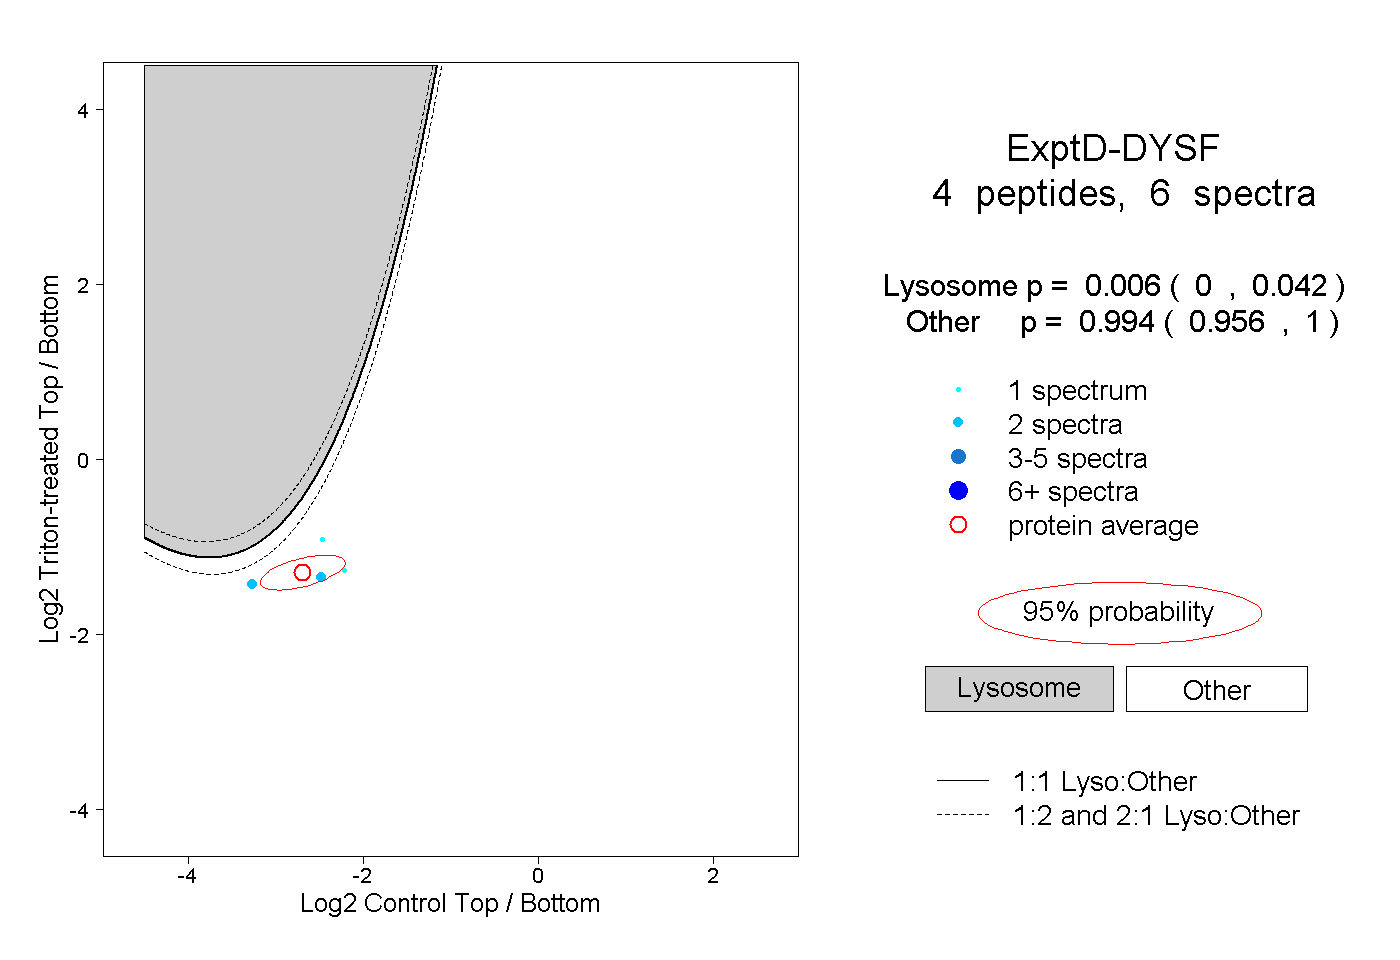
0.000 | 0.042
0.956 | 1.000