 30
30peptides
spectra
0.000 | 0.008
0.000 | 0.000
0.000 | 0.000
0.000 | 0.000
0.197 | 0.217
0.712 | 0.729
0.057 | 0.073
0.000 | 0.002
| Plot | Mito | Lyso | Perox | ER | Golgi | PM | Cytosol | Nucleus | |||||
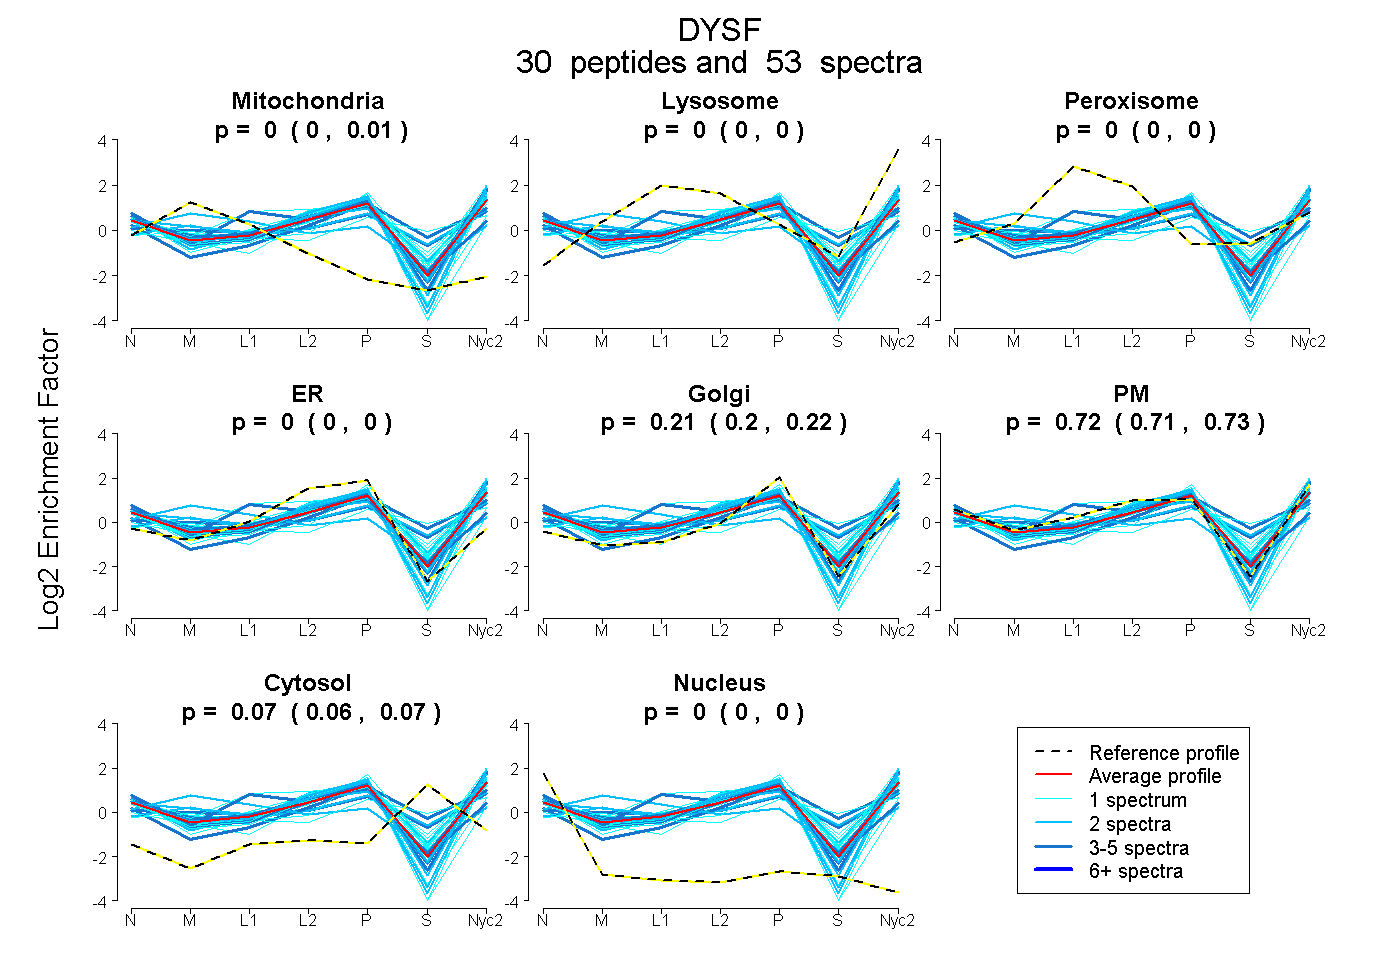
| Expt A |
30 peptides |
53 spectra |
|
0.004 0.000 | 0.008 |
0.000 0.000 | 0.000 |
0.000 0.000 | 0.000 |
0.000 0.000 | 0.000 |
0.208 0.197 | 0.217 |
0.721 0.712 | 0.729 |
0.067 0.057 | 0.073 |
0.000 0.000 | 0.002 |
| 4 spectra, GEGVAYR | 0.000 | 0.008 | 0.000 | 0.000 | 0.209 | 0.461 | 0.323 | 0.000 | ||
| 2 spectra, FFASIGER | 0.000 | 0.000 | 0.000 | 0.000 | 0.146 | 0.854 | 0.000 | 0.000 | ||
| 1 spectrum, NLVDPFVEVSFAGK | 0.000 | 0.028 | 0.000 | 0.000 | 0.146 | 0.741 | 0.085 | 0.000 | ||
| 1 spectrum, MDVGTVYR | 0.065 | 0.136 | 0.043 | 0.000 | 0.207 | 0.207 | 0.341 | 0.000 | ||
| 2 spectra, EFNQFAEGK | 0.077 | 0.154 | 0.058 | 0.000 | 0.242 | 0.260 | 0.208 | 0.000 | ||
| 2 spectra, AFGLQPK | 0.000 | 0.000 | 0.000 | 0.000 | 0.076 | 0.774 | 0.150 | 0.000 | ||
| 1 spectrum, SDPVASLIFR | 0.000 | 0.093 | 0.000 | 0.000 | 0.205 | 0.644 | 0.058 | 0.000 | ||
| 2 spectra, IGETVIDLENR | 0.000 | 0.000 | 0.000 | 0.000 | 0.181 | 0.819 | 0.000 | 0.000 | ||
| 3 spectra, EYTIQEIEAGR | 0.000 | 0.000 | 0.000 | 0.000 | 0.212 | 0.788 | 0.000 | 0.000 | ||
| 3 spectra, CDPYIK | 0.036 | 0.034 | 0.129 | 0.000 | 0.157 | 0.424 | 0.220 | 0.000 | ||
| 1 spectrum, FHLEYR | 0.000 | 0.000 | 0.000 | 0.008 | 0.122 | 0.850 | 0.000 | 0.020 | ||
| 1 spectrum, FILWR | 0.000 | 0.000 | 0.000 | 0.152 | 0.420 | 0.352 | 0.000 | 0.076 | ||
| 1 spectrum, ASNLPNVK | 0.000 | 0.000 | 0.000 | 0.000 | 0.218 | 0.644 | 0.139 | 0.000 | ||
| 1 spectrum, GAHFCLK | 0.069 | 0.000 | 0.000 | 0.375 | 0.166 | 0.341 | 0.000 | 0.049 | ||
| 1 spectrum, EAALALK | 0.000 | 0.000 | 0.000 | 0.000 | 0.180 | 0.818 | 0.000 | 0.002 | ||
| 1 spectrum, LVEHSEQK | 0.000 | 0.083 | 0.000 | 0.000 | 0.090 | 0.693 | 0.134 | 0.000 | ||
| 1 spectrum, LWFGLSVDEK | 0.000 | 0.000 | 0.260 | 0.011 | 0.201 | 0.528 | 0.000 | 0.000 | ||
| 1 spectrum, TAIEILAWGLR | 0.000 | 0.000 | 0.000 | 0.000 | 0.281 | 0.702 | 0.015 | 0.001 | ||
| 1 spectrum, DVILDDLSLTGEK | 0.000 | 0.000 | 0.000 | 0.000 | 0.191 | 0.798 | 0.000 | 0.011 | ||
| 3 spectra, SLGGEGNFNWR | 0.000 | 0.000 | 0.146 | 0.000 | 0.060 | 0.751 | 0.021 | 0.022 | ||
| 2 spectra, VMDWDR | 0.000 | 0.000 | 0.000 | 0.000 | 0.252 | 0.748 | 0.000 | 0.000 | ||
| 1 spectrum, RPDTSFLWFTSPYK | 0.000 | 0.026 | 0.000 | 0.000 | 0.242 | 0.598 | 0.133 | 0.000 | ||
| 2 spectra, GWWPCVTEEGAK | 0.359 | 0.056 | 0.120 | 0.000 | 0.208 | 0.258 | 0.000 | 0.000 | ||
| 1 spectrum, QAEAEGEGWEYASLFGWK | 0.000 | 0.073 | 0.004 | 0.000 | 0.587 | 0.239 | 0.096 | 0.000 | ||
| 5 spectra, RPVVGQCTIR | 0.000 | 0.000 | 0.000 | 0.234 | 0.121 | 0.507 | 0.052 | 0.085 | ||
| 1 spectrum, VETQNQLLR | 0.000 | 0.000 | 0.000 | 0.000 | 0.069 | 0.728 | 0.202 | 0.000 | ||
| 3 spectra, VEDLPADDILR | 0.000 | 0.020 | 0.000 | 0.000 | 0.178 | 0.803 | 0.000 | 0.000 | ||
| 2 spectra, WLLLSDPDDFSAGAR | 0.000 | 0.000 | 0.000 | 0.000 | 0.203 | 0.797 | 0.000 | 0.000 | ||
| 1 spectrum, LLSDKPQDFQIR | 0.000 | 0.000 | 0.000 | 0.000 | 0.169 | 0.731 | 0.101 | 0.000 | ||
| 2 spectra, TDALLGEFR | 0.090 | 0.032 | 0.000 | 0.000 | 0.100 | 0.778 | 0.000 | 0.000 |
| Plot | Mito | Lyso or Perox | ER | Golgi | PM | Cytosol | Nucleus | ||||||
| Expt B |
4 peptides |
6 spectra |
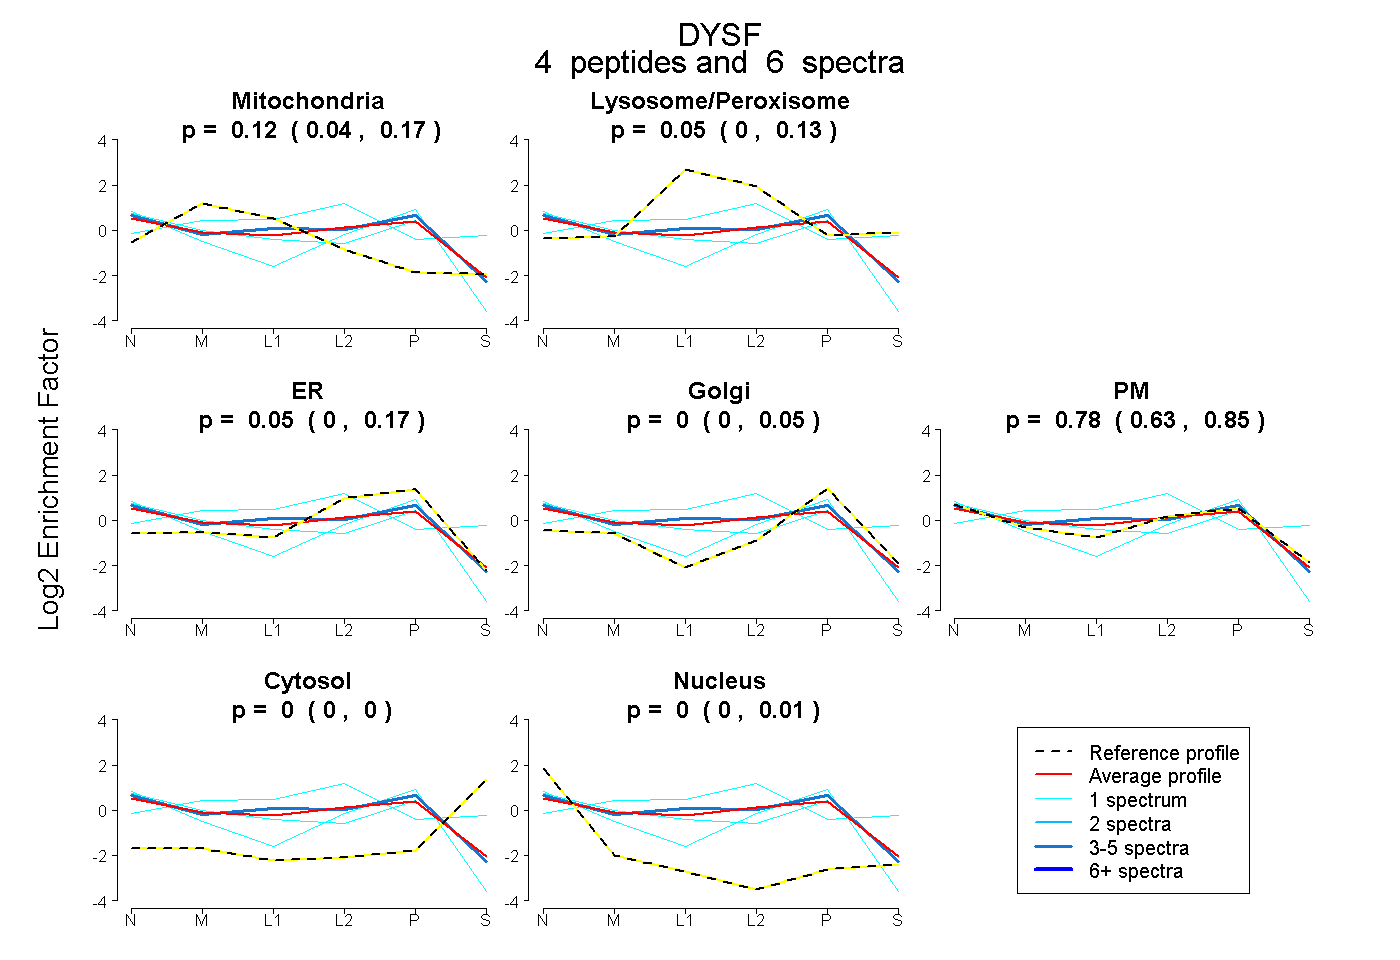 |
0.115 0.043 | 0.172 |
0.054 0.000 | 0.134 |
0.055 0.000 | 0.170 |
0.000 0.000 | 0.054 |
0.776 0.631 | 0.847 |
0.000 0.000 | 0.000 |
0.000 0.000 | 0.007 |
|||
| Plot | Lyso | Other | |||||||||||
| Expt C |
26 peptides |
51 spectra |
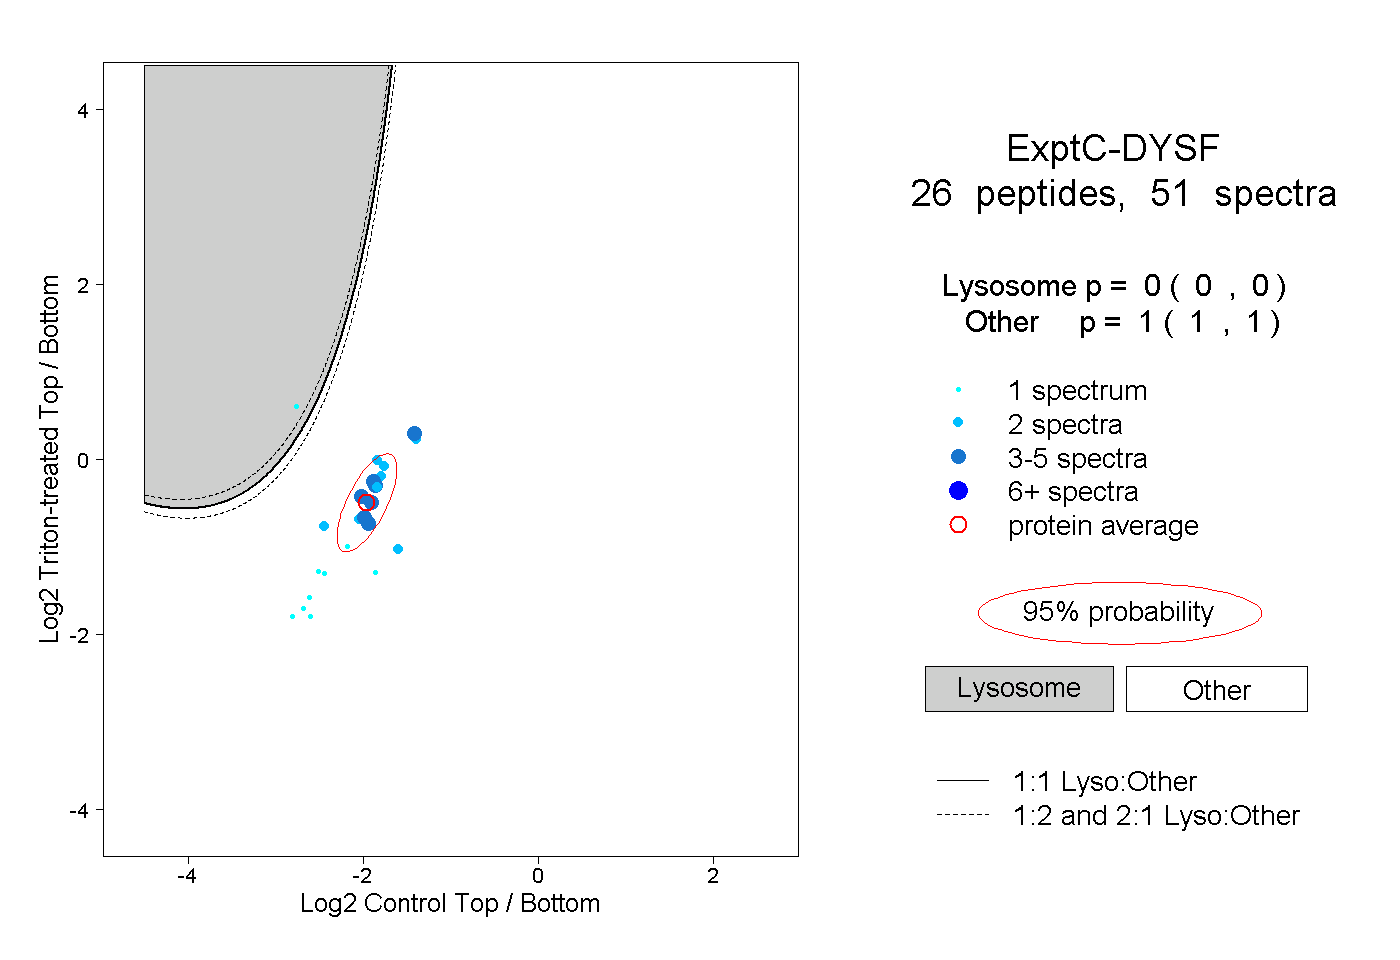 |
0.000 0.000 | 0.000 |
1.000 1.000 | 1.000 |
||||||||
| Plot | Lyso | Other | |||||||||||
| Expt D |
4 peptides |
6 spectra |
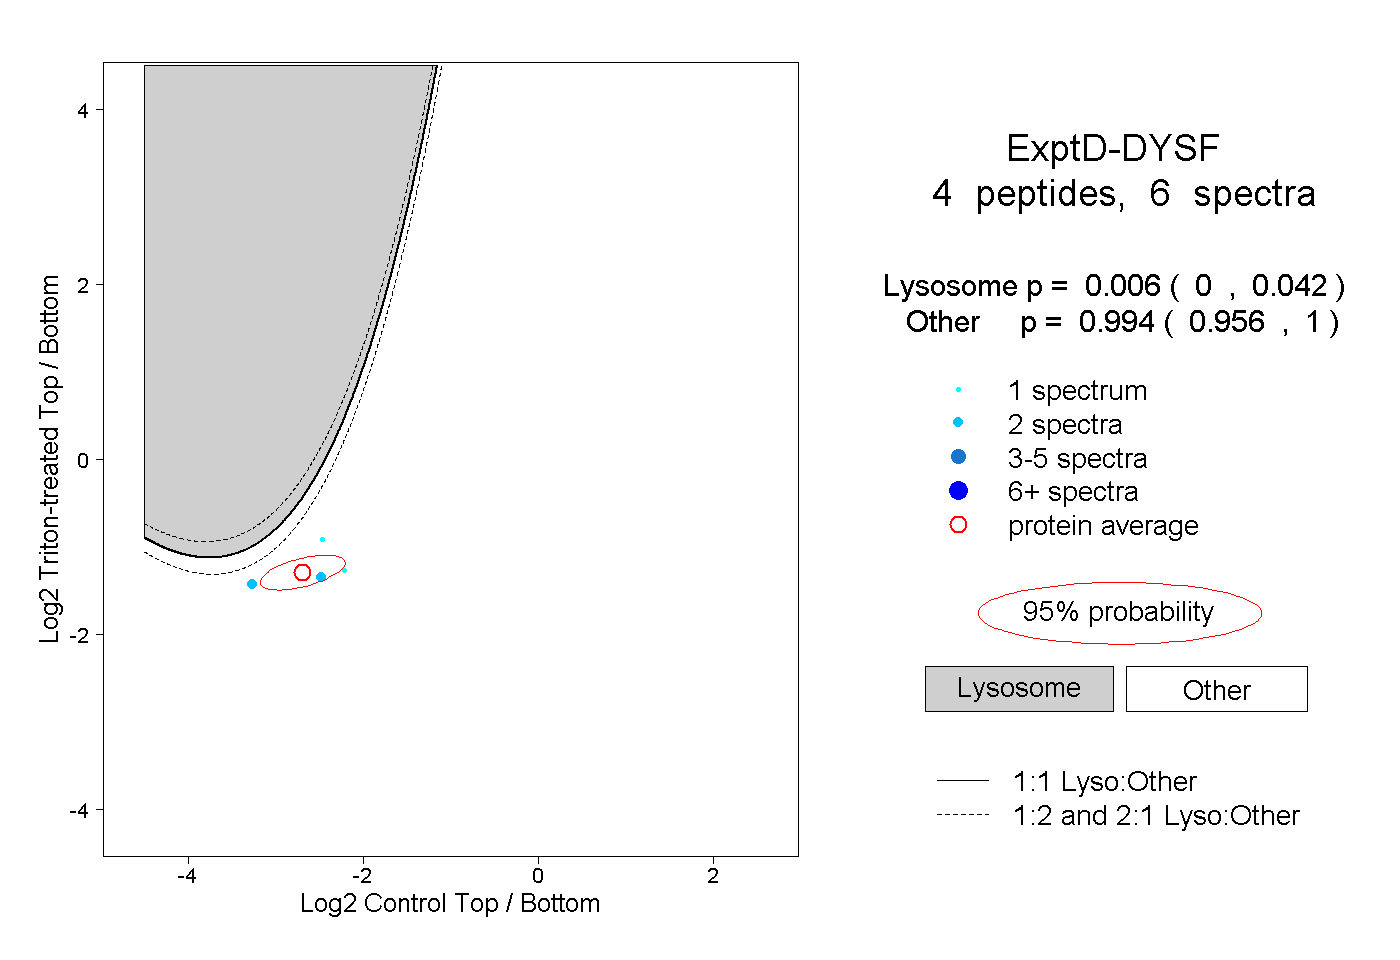 |
0.006 0.000 | 0.042 |
0.994 0.956 | 1.000 |