 9
9peptides
spectra
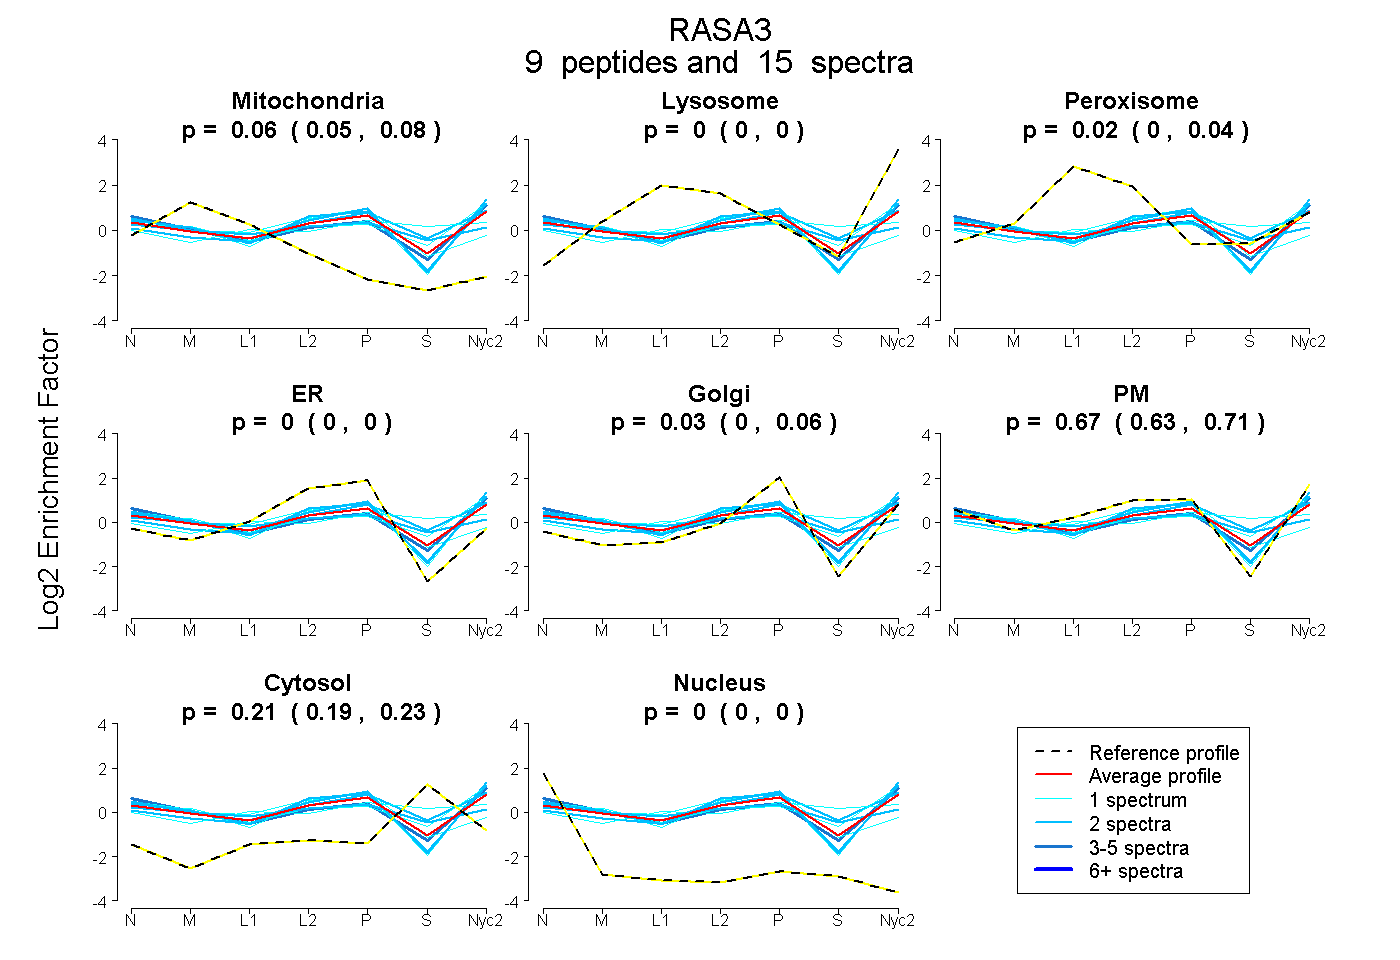
0.047 | 0.079
0.000 | 0.000
0.004 | 0.038
0.000 | 0.000
0.000 | 0.055
0.630 | 0.710
0.194 | 0.228
0.000 | 0.000
2peptides
spectra
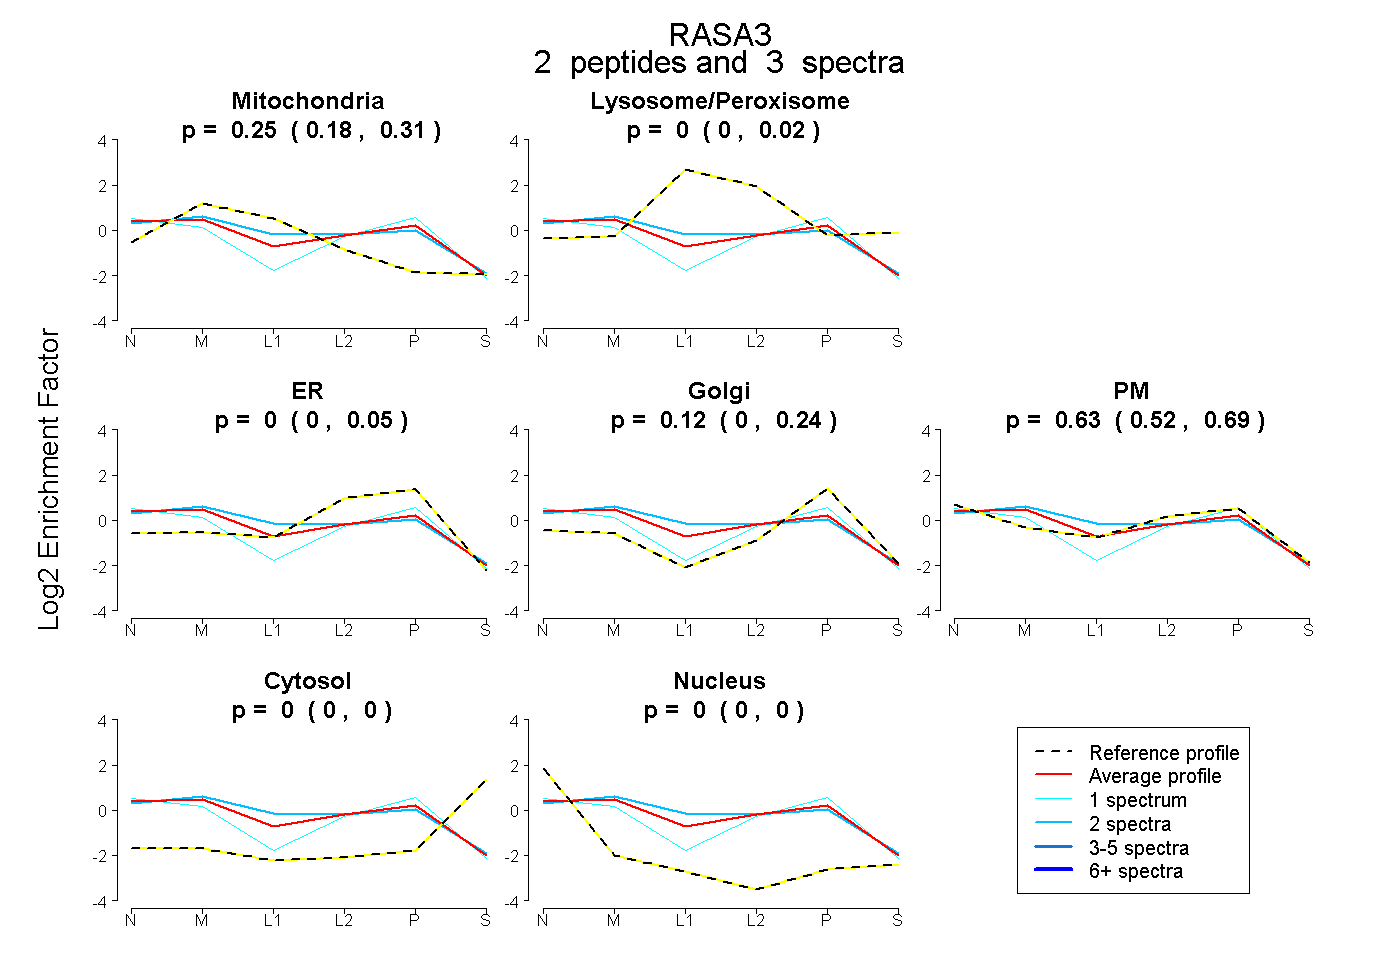
0.182 | 0.307
0.000 | 0.019
0.000 | 0.055
0.000 | 0.243
0.517 | 0.687
0.000 | 0.000
0.000 | 0.005
9peptides
spectra
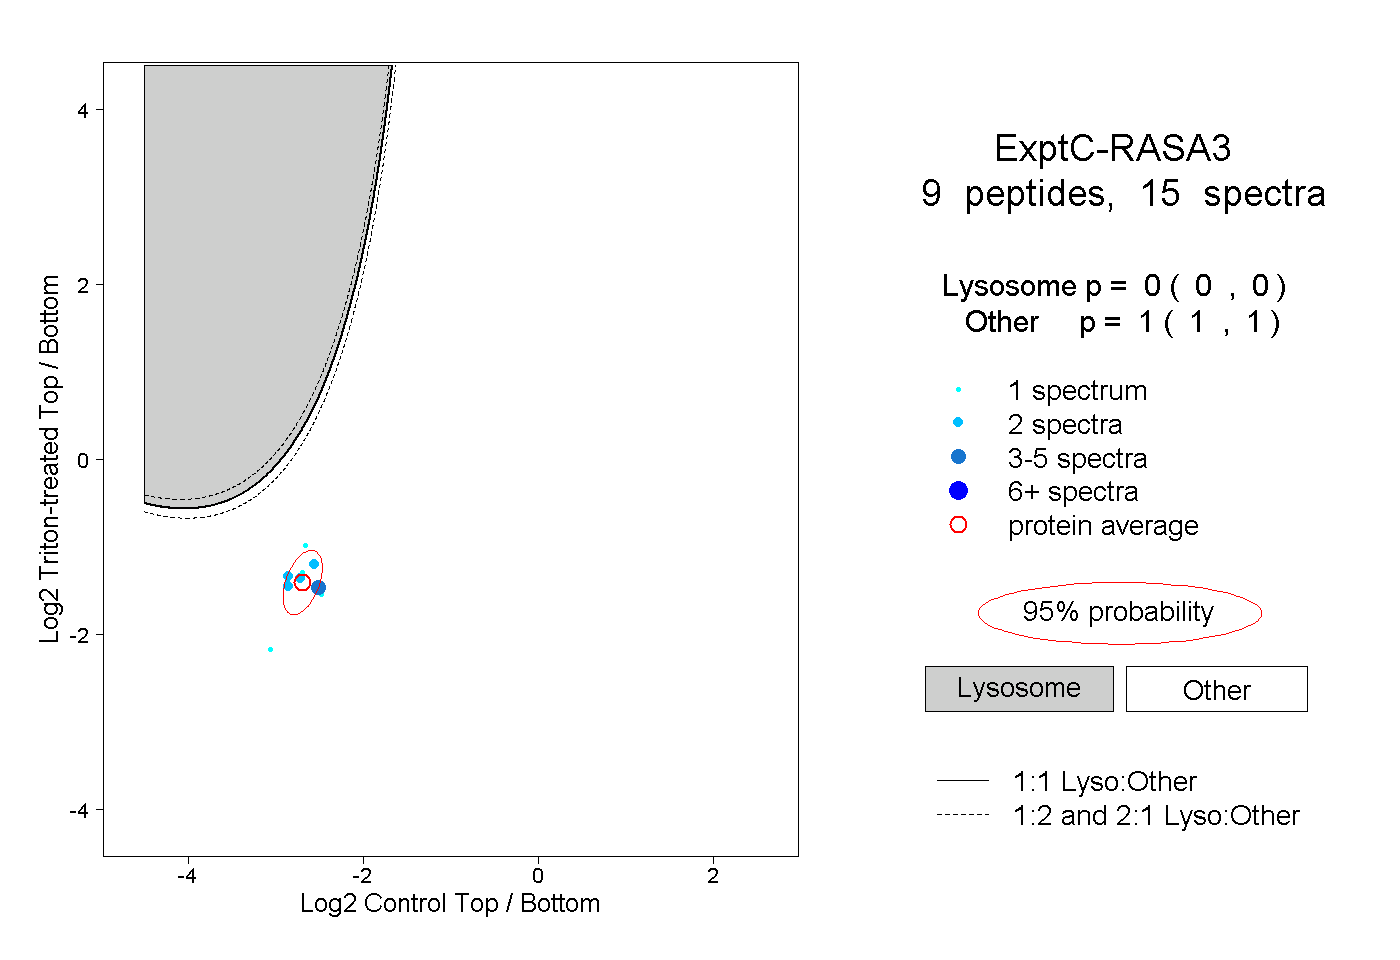
0.000 | 0.000
1.000 | 1.000
2peptides
spectra
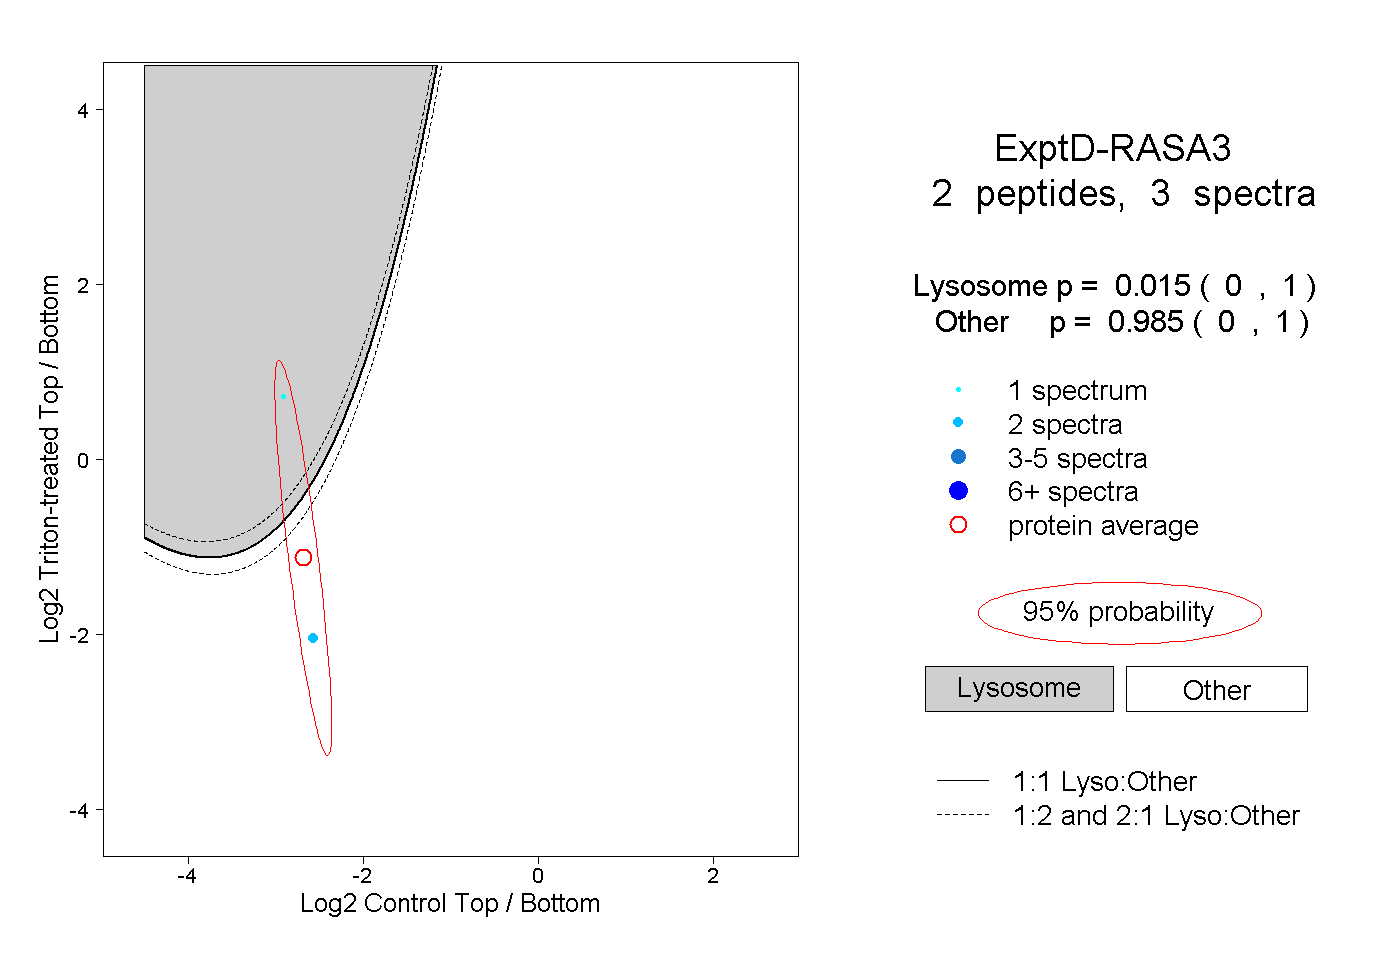
0.000 | 1.000
0.000 | 1.000