 9
9peptides
spectra
0.047 | 0.079
0.000 | 0.000
0.004 | 0.038
0.000 | 0.000
0.000 | 0.055
0.630 | 0.710
0.194 | 0.228
0.000 | 0.000
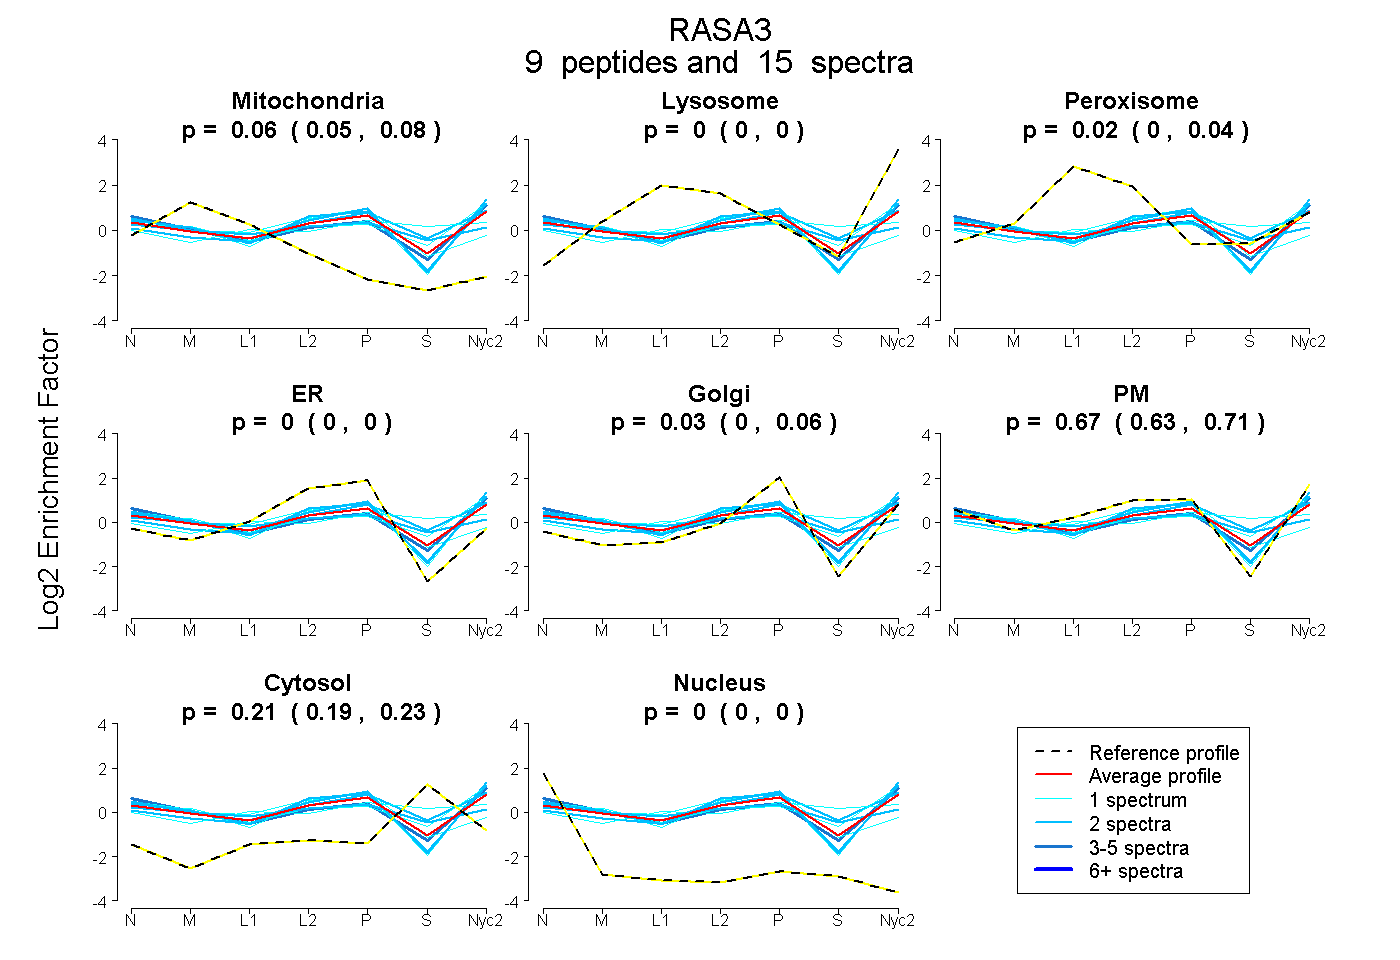
| Plot | Mito | Lyso | Perox | ER | Golgi | PM | Cytosol | Nucleus | |||||
| Expt A |
9 peptides |
15 spectra |
|
0.065 0.047 | 0.079 |
0.000 0.000 | 0.000 |
0.023 0.004 | 0.038 |
0.000 0.000 | 0.000 |
0.026 0.000 | 0.055 |
0.674 0.630 | 0.710 |
0.212 0.194 | 0.228 |
0.000 0.000 | 0.000 |
| 2 spectra, SCEIDPVK | 0.114 | 0.000 | 0.148 | 0.000 | 0.090 | 0.380 | 0.267 | 0.000 | ||
| 3 spectra, DGENLENNMESLR | 0.096 | 0.000 | 0.000 | 0.000 | 0.000 | 0.723 | 0.181 | 0.000 | ||
| 2 spectra, NFLDLISSSGR | 0.049 | 0.000 | 0.000 | 0.000 | 0.106 | 0.773 | 0.072 | 0.000 | ||
| 1 spectrum, LSEVITDTGVVCHK | 0.119 | 0.000 | 0.093 | 0.355 | 0.054 | 0.227 | 0.153 | 0.000 | ||
| 1 spectrum, IPLHVLR | 0.075 | 0.000 | 0.000 | 0.000 | 0.147 | 0.725 | 0.053 | 0.000 | ||
| 2 spectra, VHLELR | 0.068 | 0.000 | 0.000 | 0.000 | 0.103 | 0.743 | 0.086 | 0.000 | ||
| 1 spectrum, QVIAGVGTLEQEHAQYR | 0.076 | 0.108 | 0.000 | 0.000 | 0.000 | 0.565 | 0.251 | 0.000 | ||
| 1 spectrum, SADVEPVSASAAHILGEVCR | 0.000 | 0.000 | 0.244 | 0.000 | 0.146 | 0.241 | 0.369 | 0.000 | ||
| 2 spectra, LLLHYGR | 0.000 | 0.034 | 0.052 | 0.000 | 0.085 | 0.525 | 0.304 | 0.000 |
| Plot | Mito | Lyso or Perox | ER | Golgi | PM | Cytosol | Nucleus | ||||||
| Expt B |
2 peptides |
3 spectra |
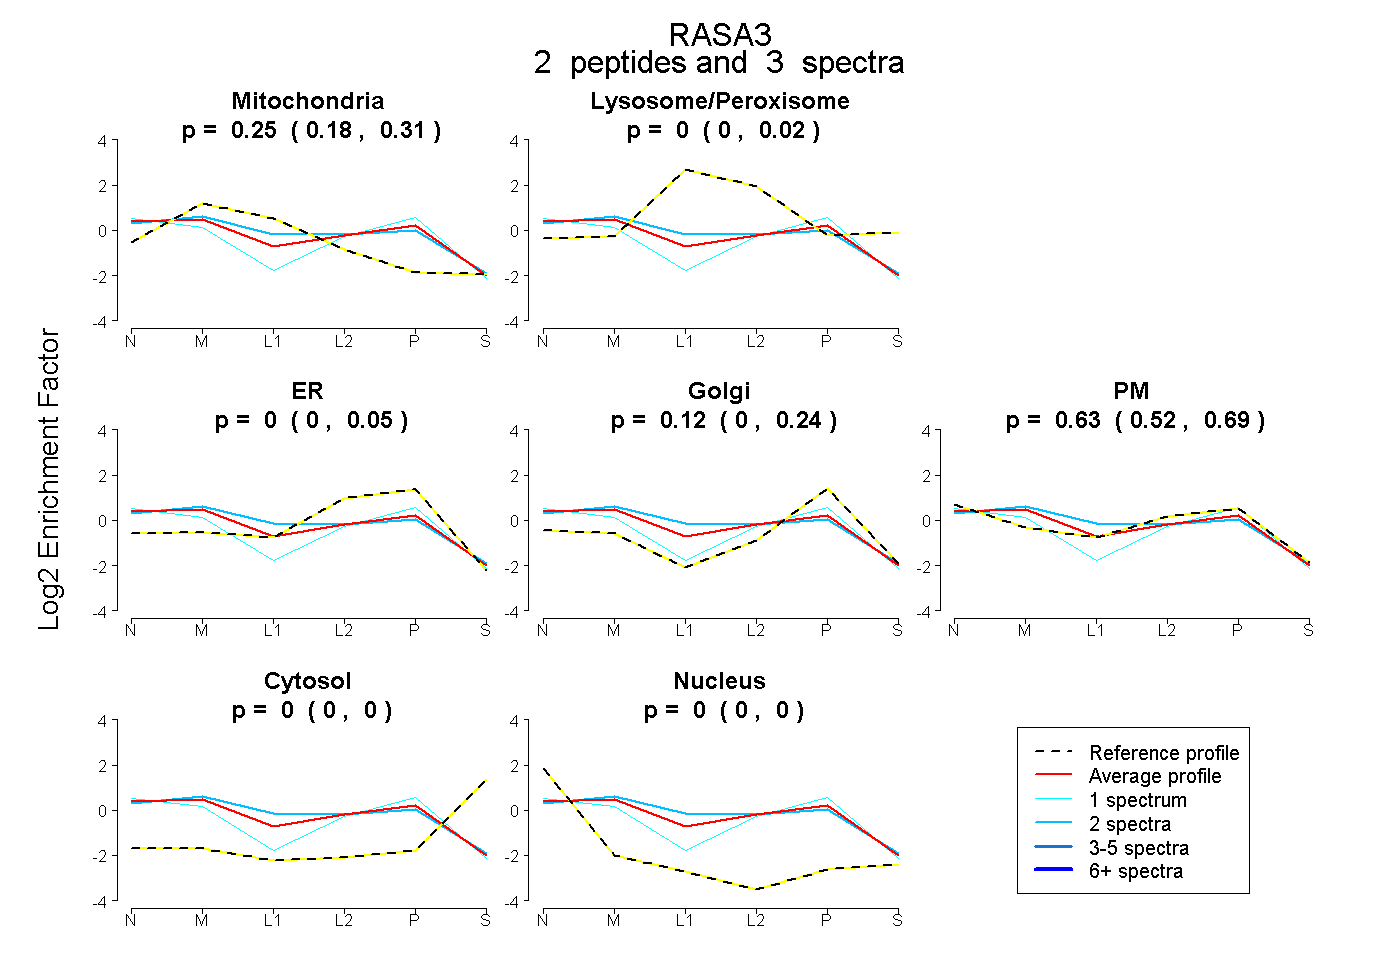 |
0.247 0.182 | 0.307 |
0.000 0.000 | 0.019 |
0.000 0.000 | 0.055 |
0.119 0.000 | 0.243 |
0.634 0.517 | 0.687 |
0.000 0.000 | 0.000 |
0.000 0.000 | 0.005 |
|||
| Plot | Lyso | Other | |||||||||||
| Expt C |
9 peptides |
15 spectra |
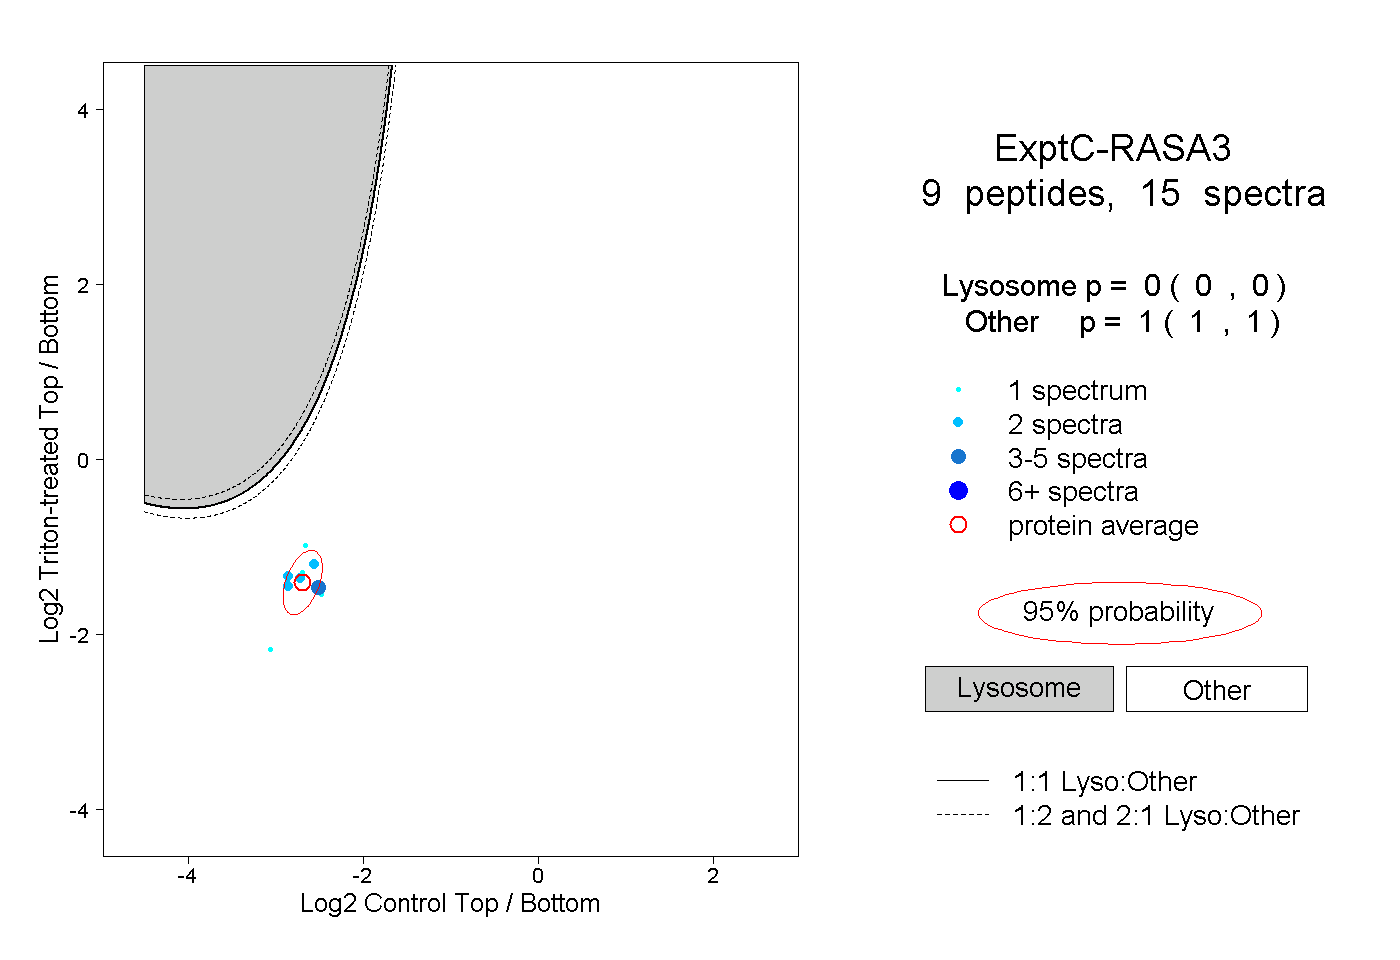 |
0.000 0.000 | 0.000 |
1.000 1.000 | 1.000 |
||||||||
| Plot | Lyso | Other | |||||||||||
| Expt D |
2 peptides |
3 spectra |
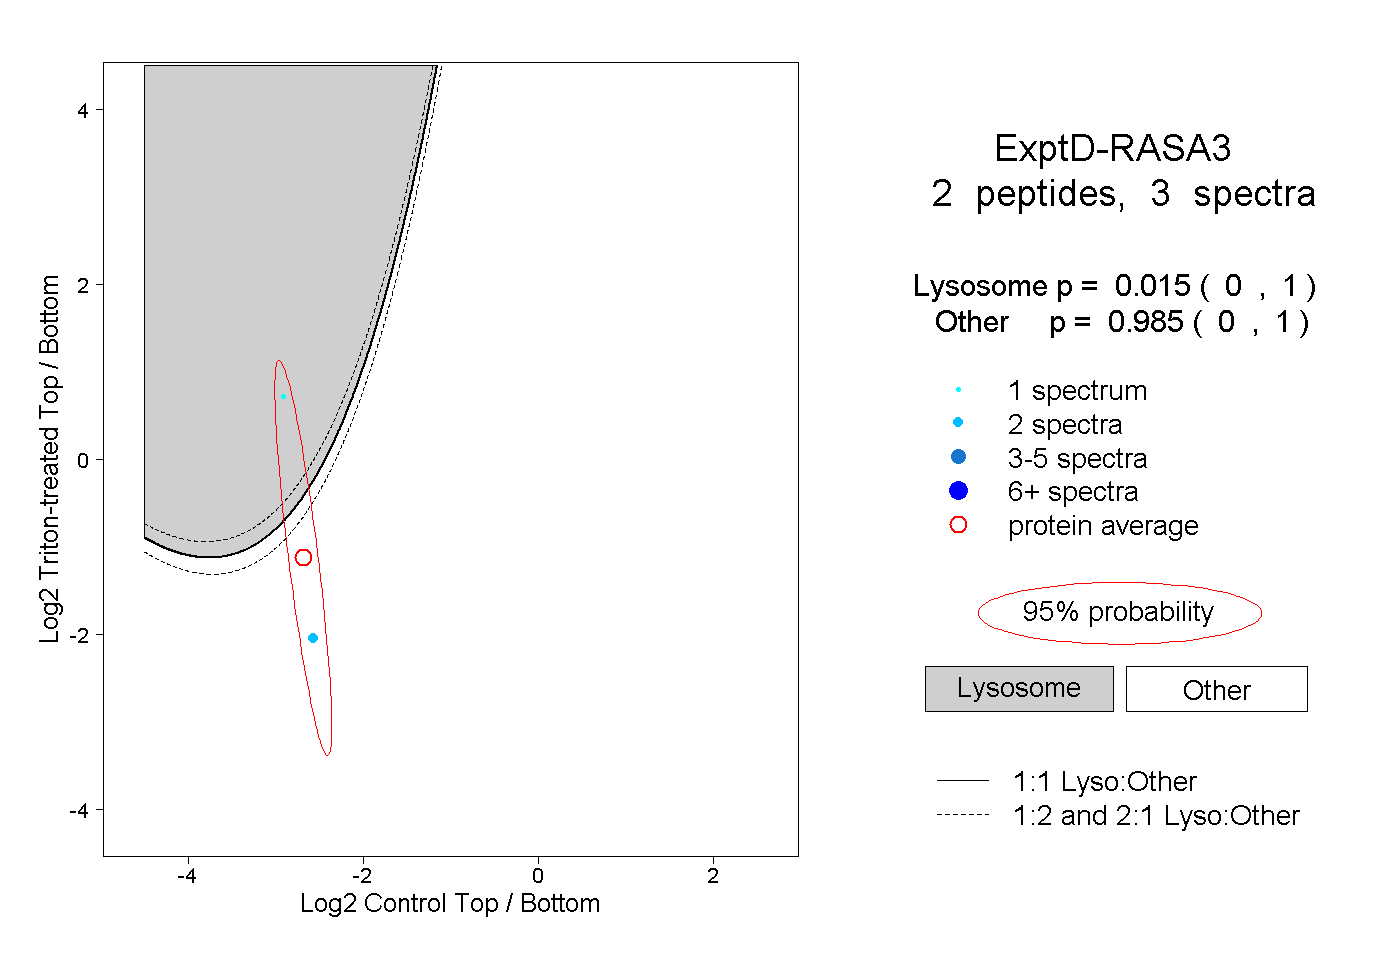 |
0.015 0.000 | 1.000 |
0.985 0.000 | 1.000 |