 8
8peptides
spectra
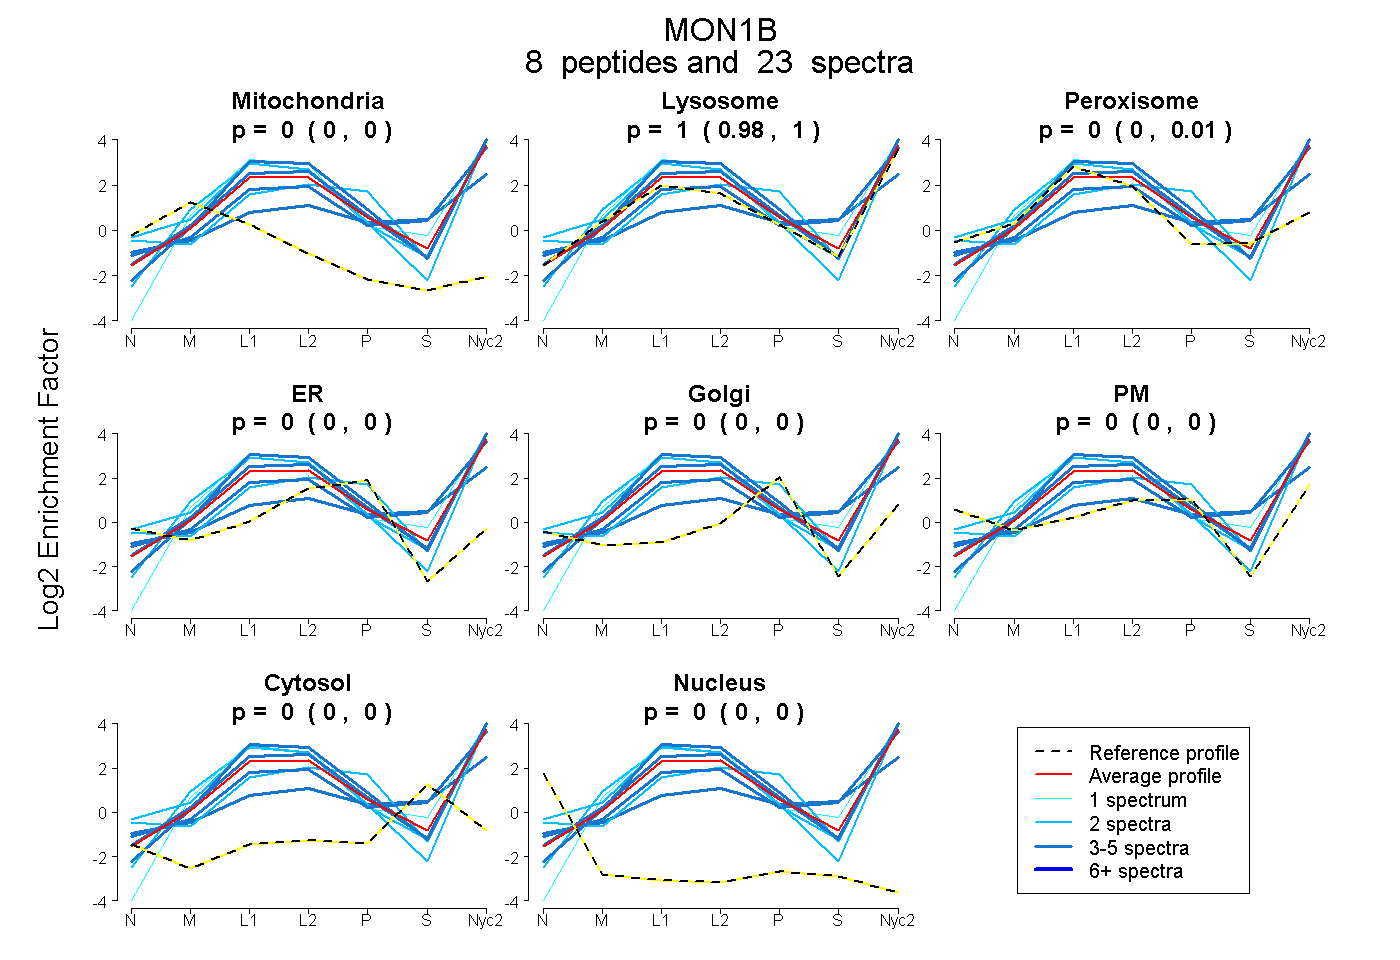
0.000 | 0.000
0.982 | 1.000
0.000 | 0.013
0.000 | 0.000
0.000 | 0.000
0.000 | 0.000
0.000 | 0.000
0.000 | 0.000
3peptides
spectra
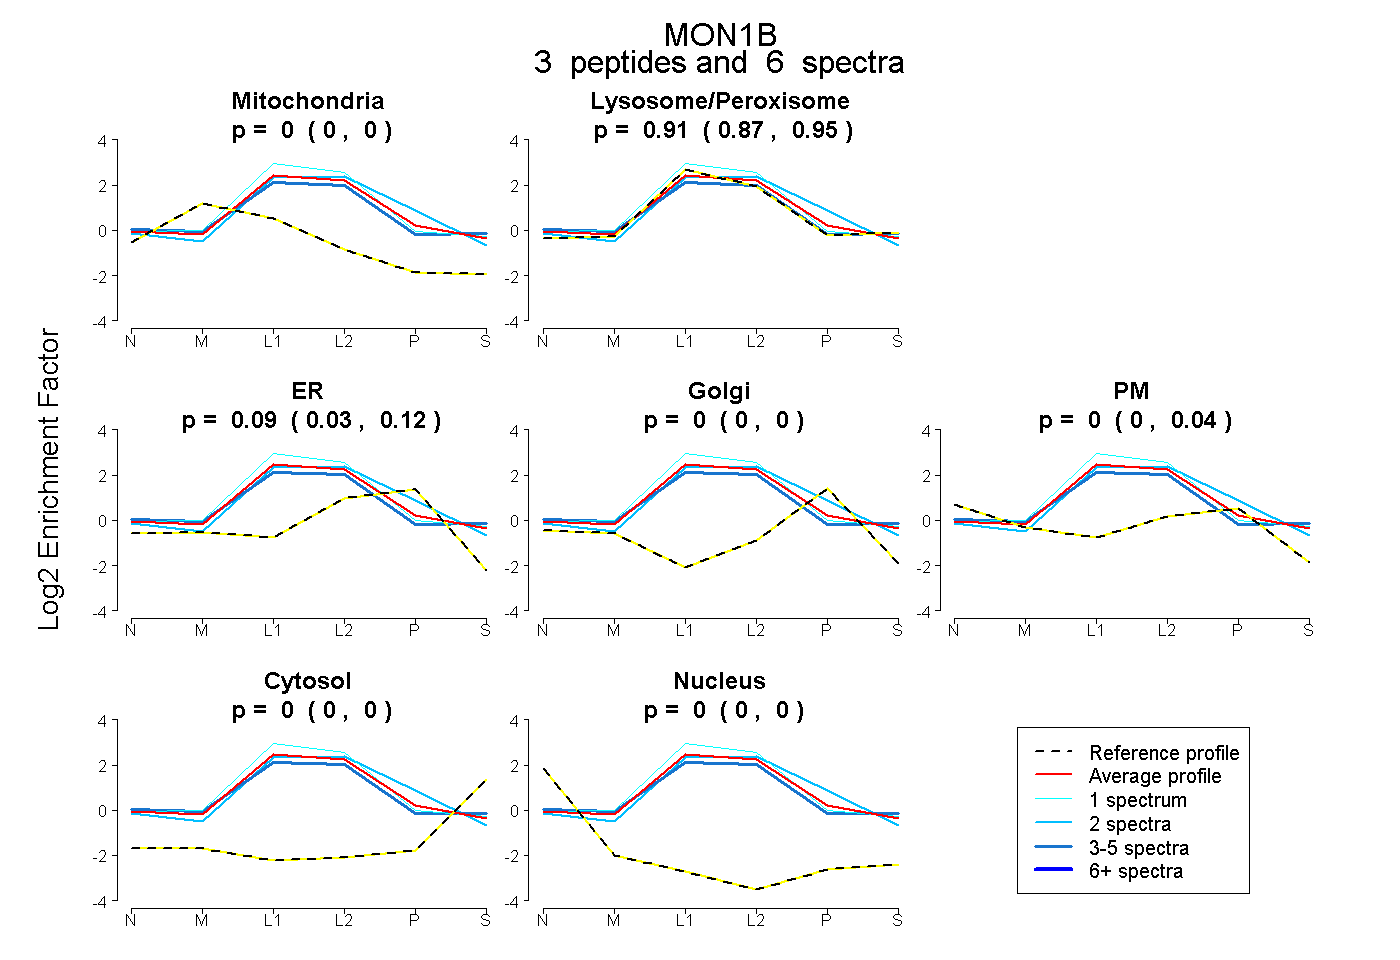
0.000 | 0.000
0.872 | 0.949
0.025 | 0.121
0.000 | 0.000
0.000 | 0.037
0.000 | 0.000
0.000 | 0.000
15peptides
spectra
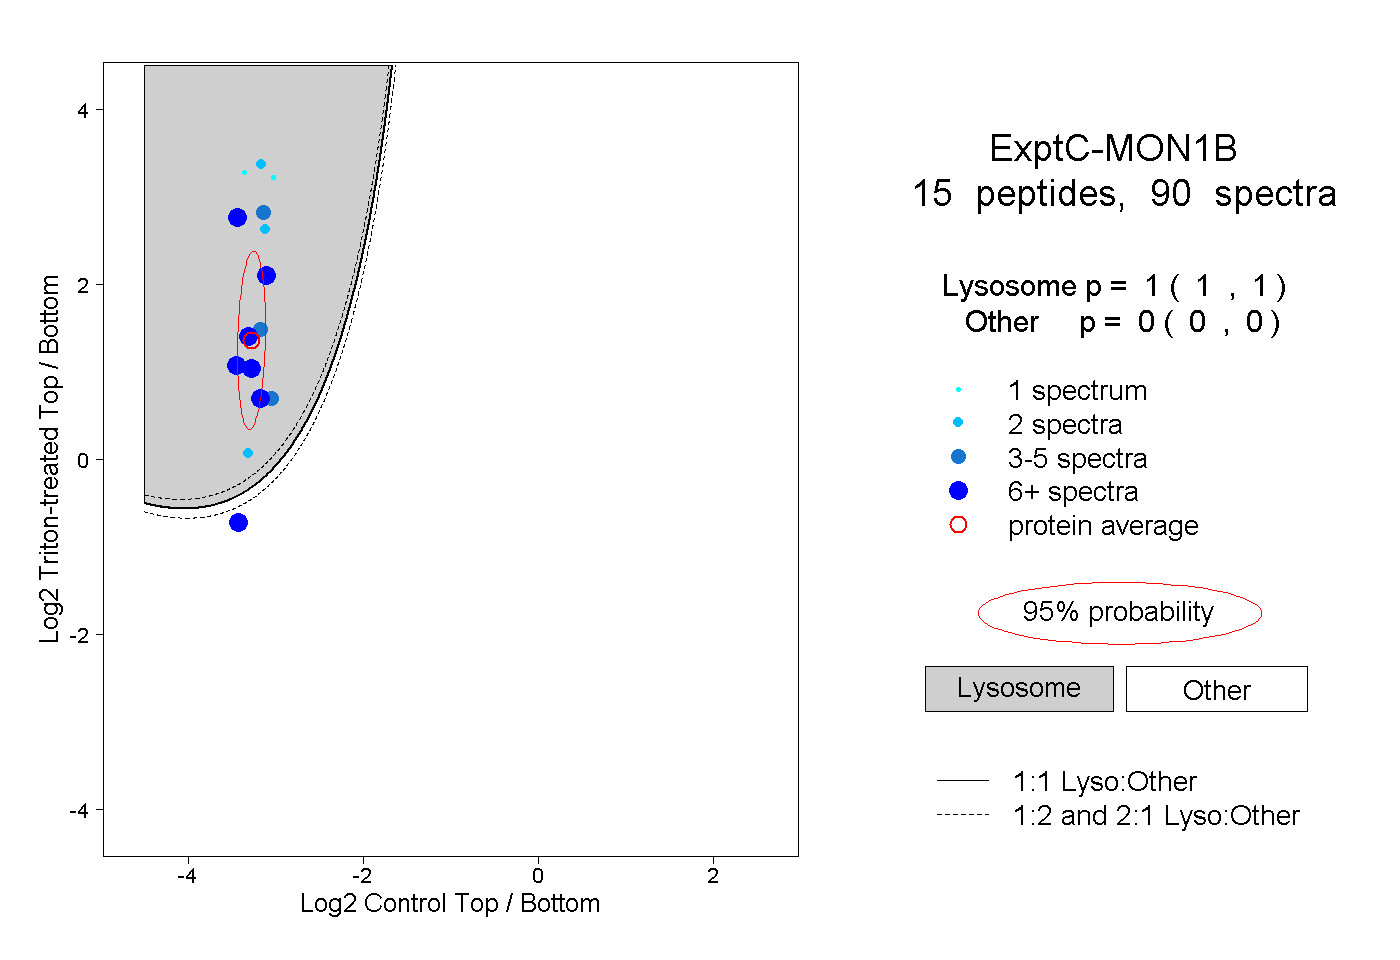
1.000 | 1.000
0.000 | 0.000
4peptides
spectra
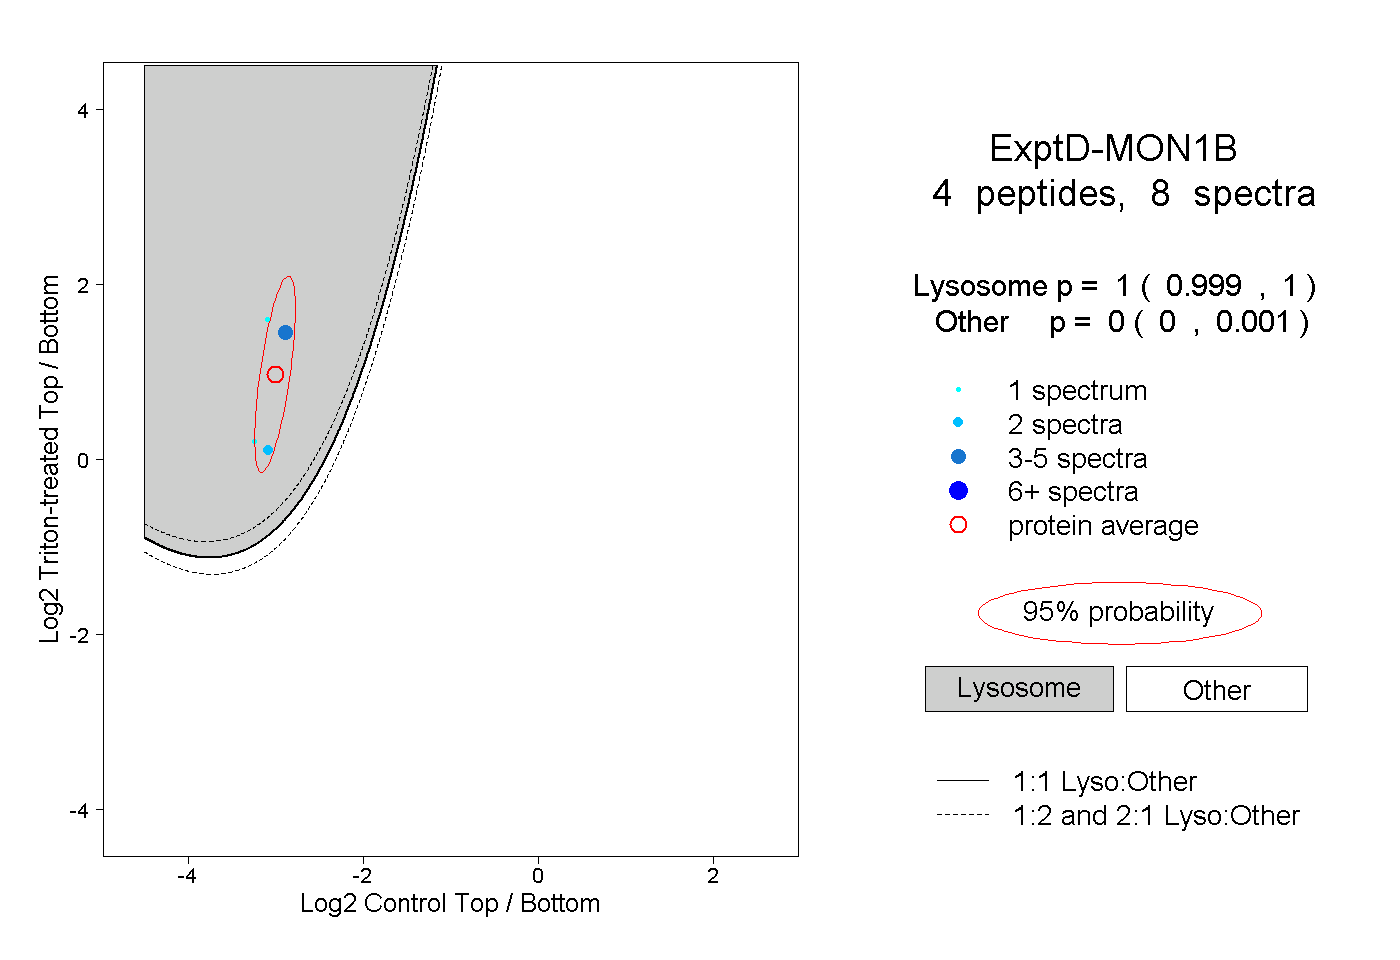
0.999 | 1.000
0.000 | 0.001