 8
8peptides
spectra
0.000 | 0.000
0.982 | 1.000
0.000 | 0.013
0.000 | 0.000
0.000 | 0.000
0.000 | 0.000
0.000 | 0.000
0.000 | 0.000
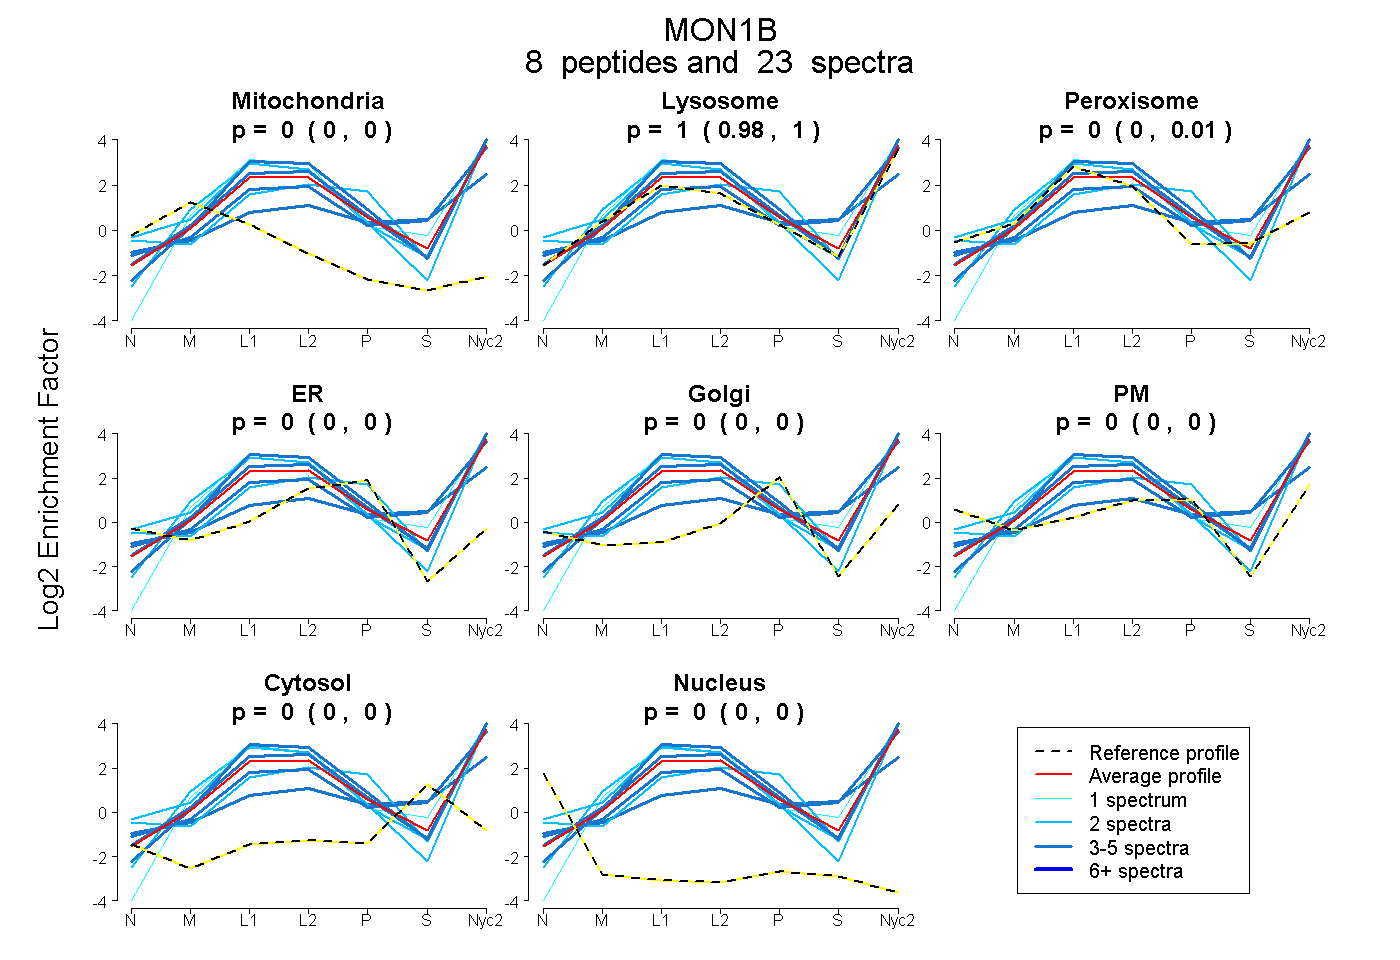
| Plot | Mito | Lyso | Perox | ER | Golgi | PM | Cytosol | Nucleus | |||||
| Expt A |
8 peptides |
23 spectra |
|
0.000 0.000 | 0.000 |
1.000 0.982 | 1.000 |
0.000 0.000 | 0.013 |
0.000 0.000 | 0.000 |
0.000 0.000 | 0.000 |
0.000 0.000 | 0.000 |
0.000 0.000 | 0.000 |
0.000 0.000 | 0.000 |
| 2 spectra, LSDLYHR | 0.000 | 0.928 | 0.027 | 0.000 | 0.000 | 0.045 | 0.000 | 0.000 | ||
| 5 spectra, LVEDGMHNLGALR | 0.000 | 1.000 | 0.000 | 0.000 | 0.000 | 0.000 | 0.000 | 0.000 | ||
| 3 spectra, NVLAECR | 0.000 | 0.900 | 0.006 | 0.000 | 0.000 | 0.000 | 0.094 | 0.000 | ||
| 3 spectra, EAFHAMAACR | 0.000 | 0.699 | 0.000 | 0.000 | 0.000 | 0.005 | 0.296 | 0.000 | ||
| 2 spectra, DALGTLLR | 0.000 | 1.000 | 0.000 | 0.000 | 0.000 | 0.000 | 0.000 | 0.000 | ||
| 2 spectra, LLAGSER | 0.000 | 0.708 | 0.000 | 0.000 | 0.000 | 0.292 | 0.000 | 0.000 | ||
| 1 spectrum, ETLLAWVTSK | 0.000 | 1.000 | 0.000 | 0.000 | 0.000 | 0.000 | 0.000 | 0.000 | ||
| 5 spectra, TPQSAAQLR | 0.000 | 1.000 | 0.000 | 0.000 | 0.000 | 0.000 | 0.000 | 0.000 |
| Plot | Mito | Lyso or Perox | ER | Golgi | PM | Cytosol | Nucleus | ||||||
| Expt B |
3 peptides |
6 spectra |
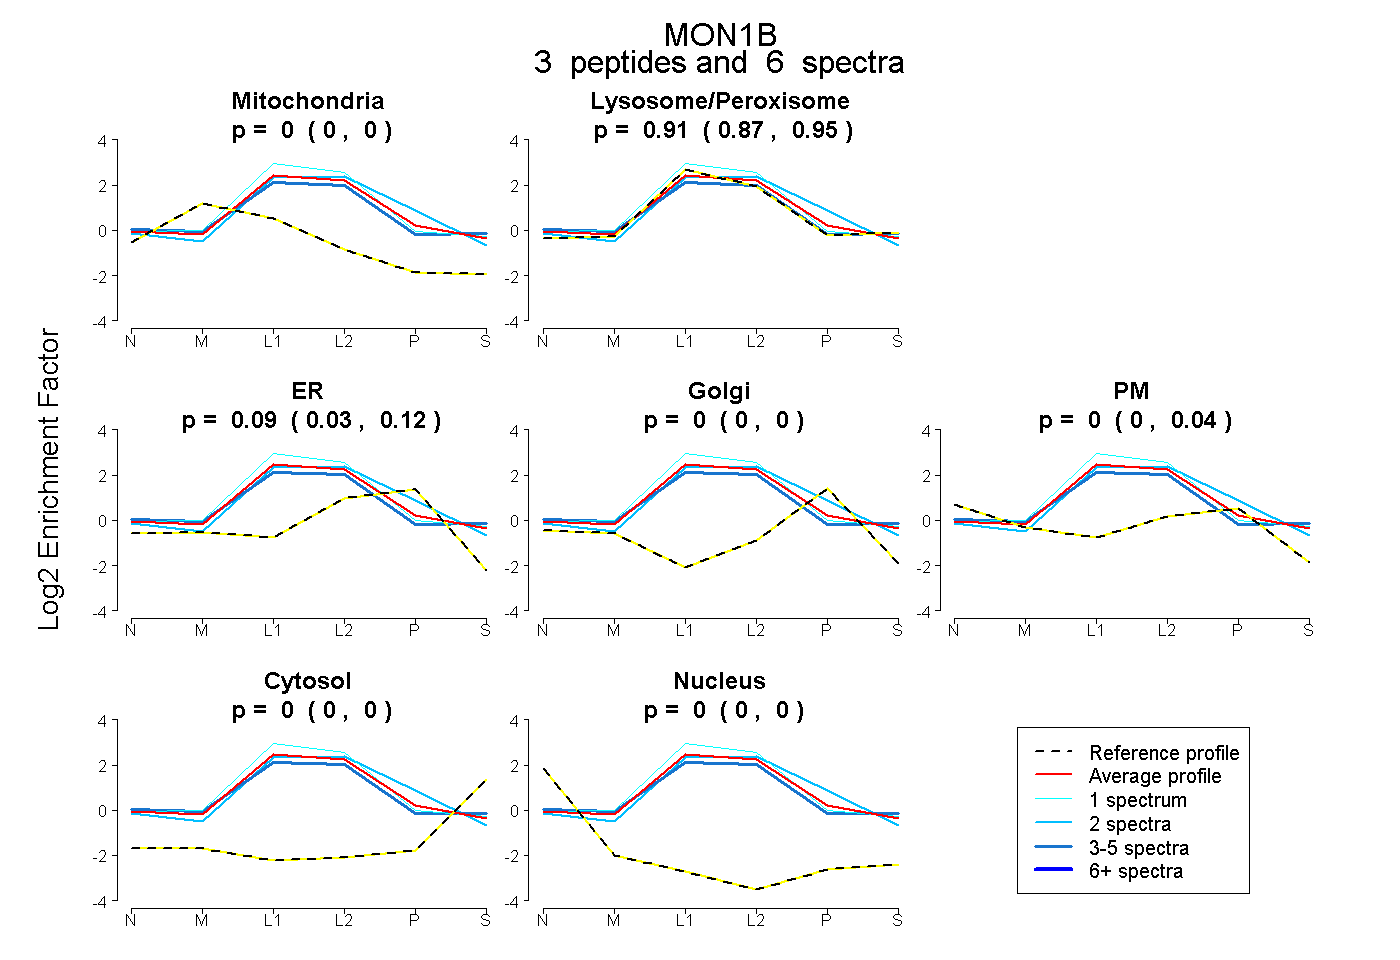 |
0.000 0.000 | 0.000 |
0.913 0.872 | 0.949 |
0.087 0.025 | 0.121 |
0.000 0.000 | 0.000 |
0.000 0.000 | 0.037 |
0.000 0.000 | 0.000 |
0.000 0.000 | 0.000 |
|||
| Plot | Lyso | Other | |||||||||||
| Expt C |
15 peptides |
90 spectra |
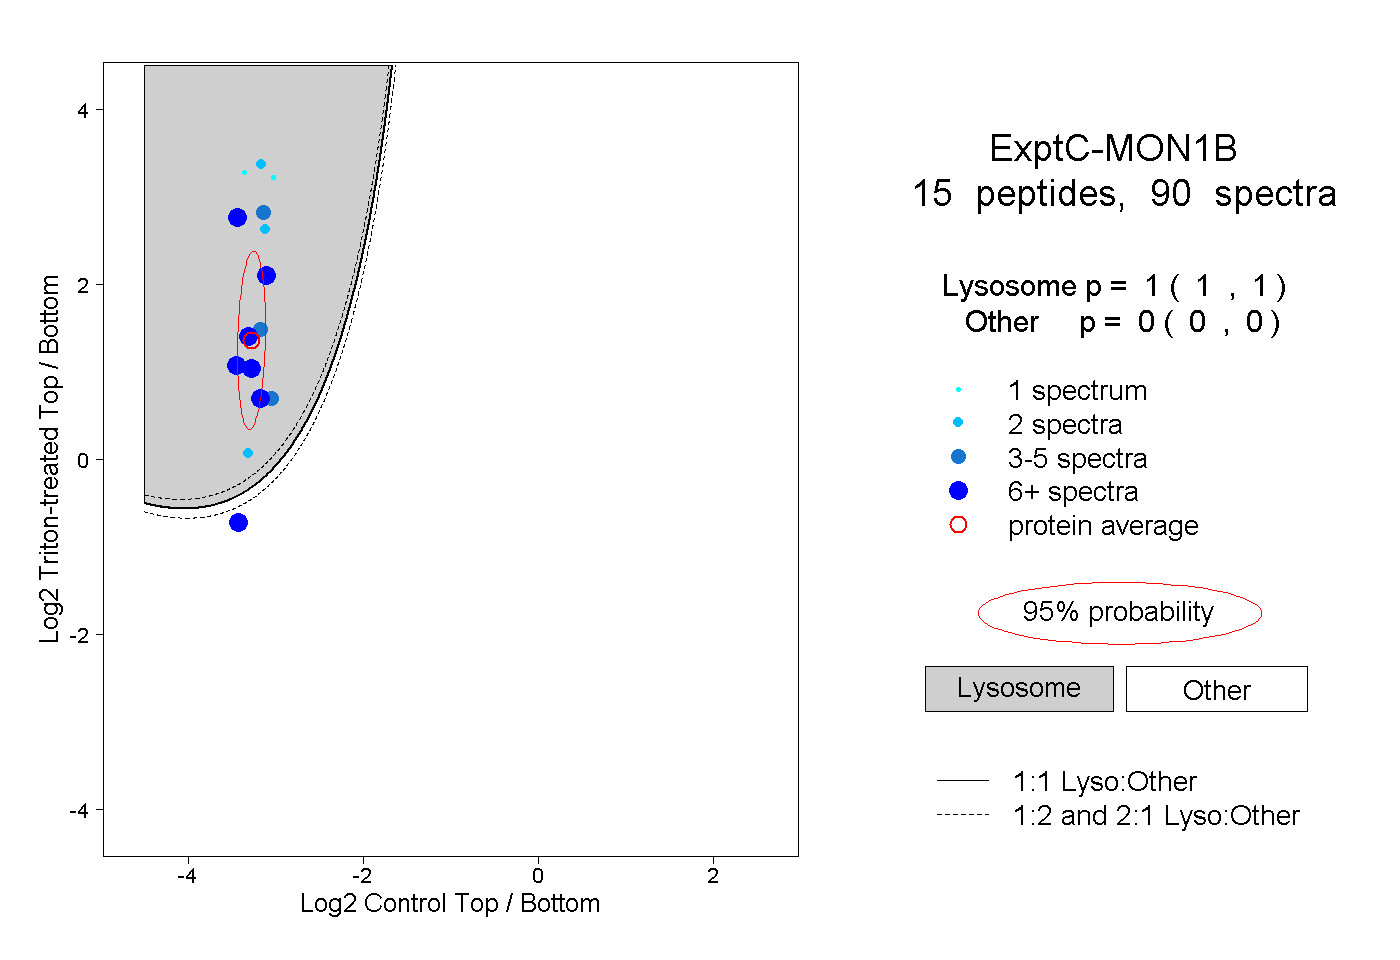 |
1.000 1.000 | 1.000 |
0.000 0.000 | 0.000 |
||||||||
| Plot | Lyso | Other | |||||||||||
| Expt D |
4 peptides |
8 spectra |
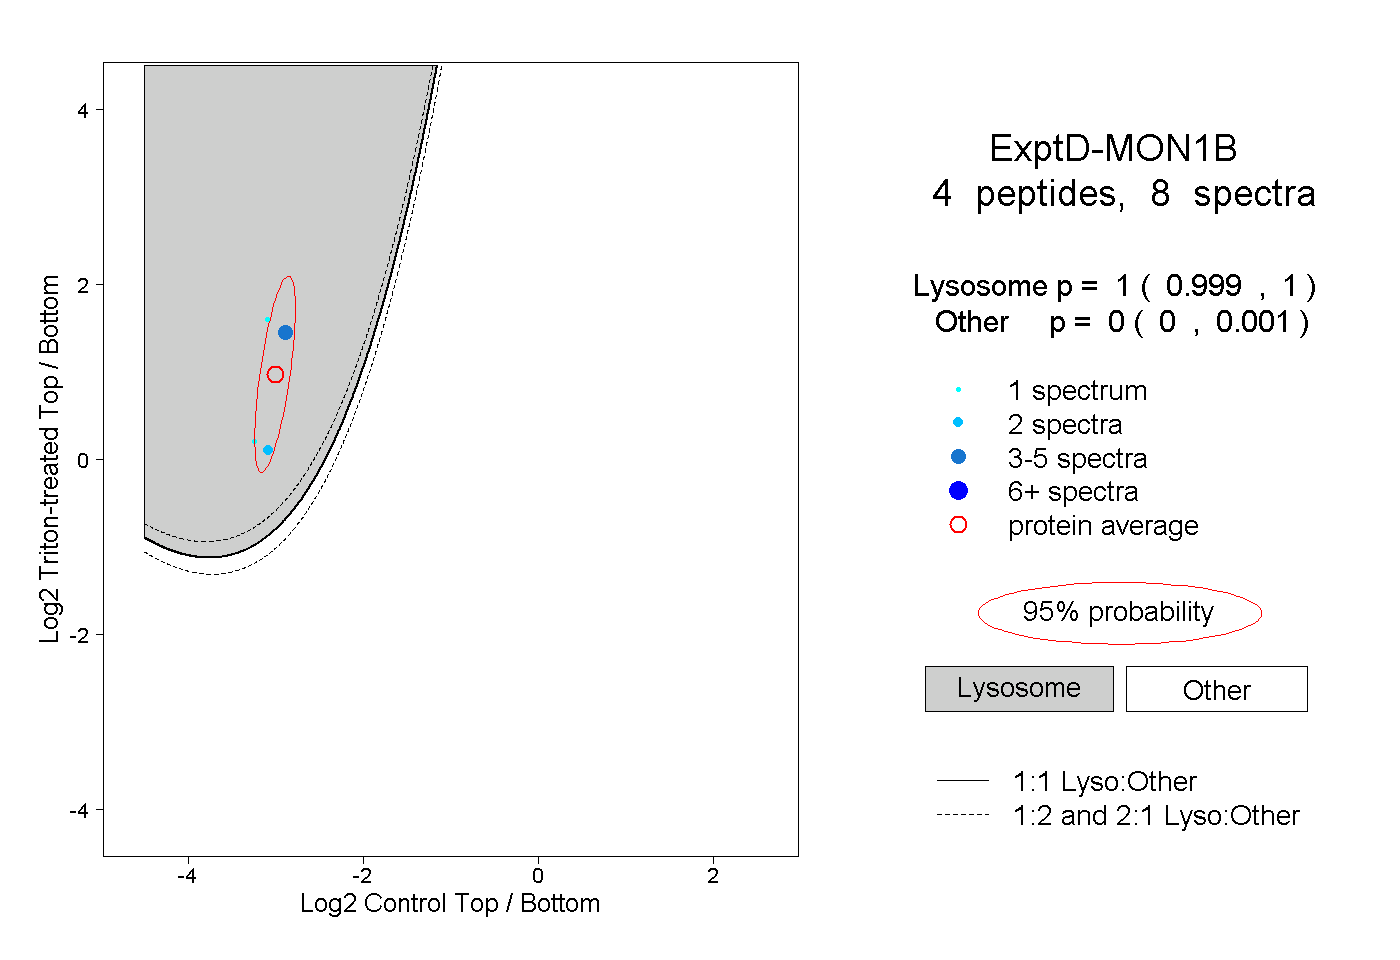 |
1.000 0.999 | 1.000 |
0.000 0.000 | 0.001 |