 20
20peptides
spectra
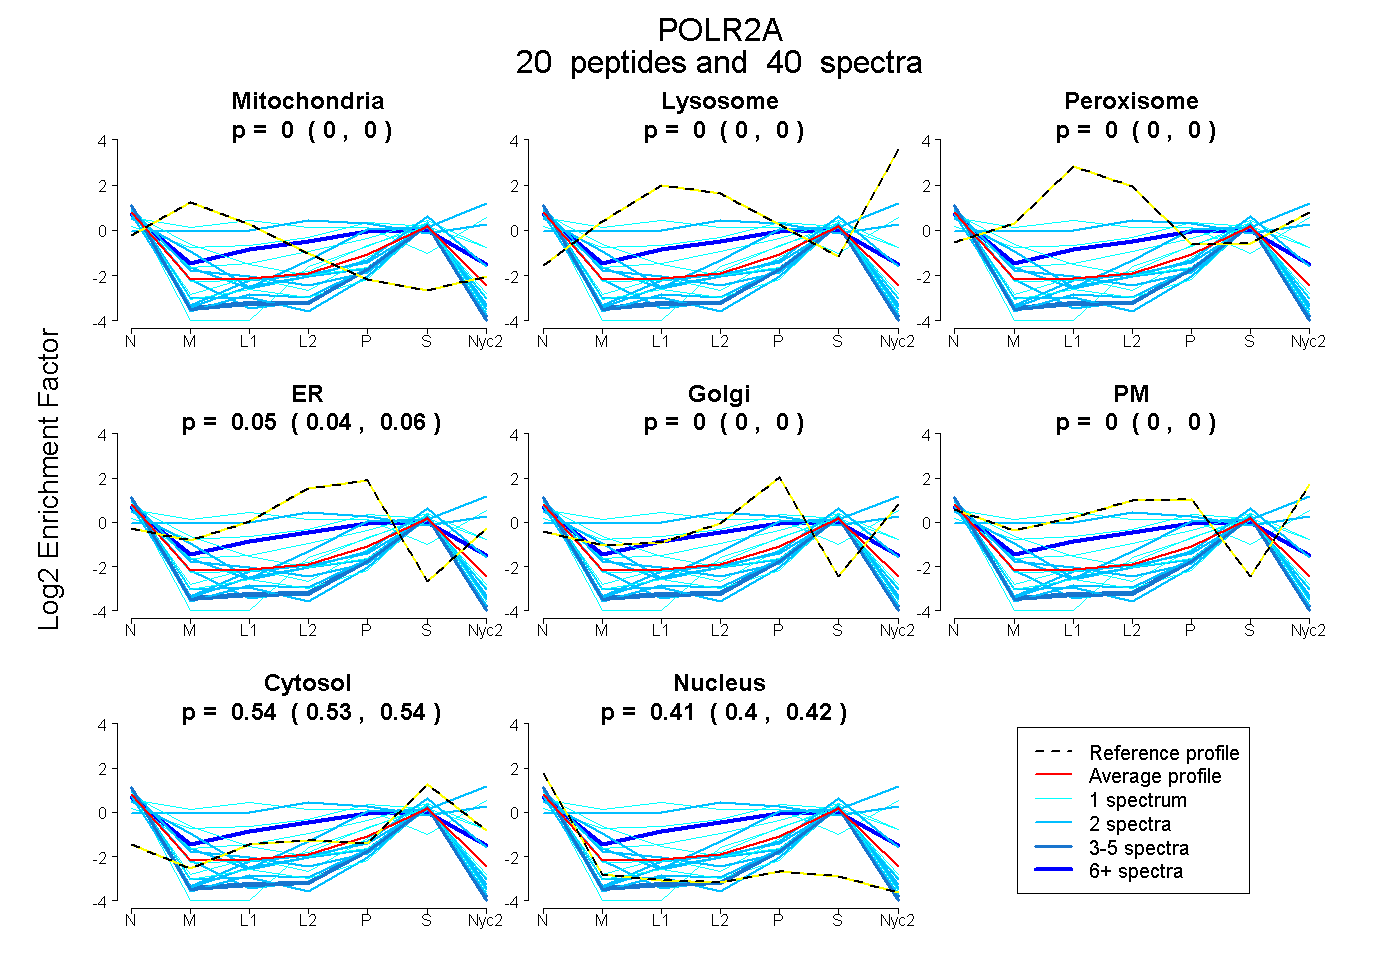
0.000 | 0.000
0.000 | 0.000
0.000 | 0.000
0.044 | 0.063
0.000 | 0.000
0.000 | 0.000
0.529 | 0.544
0.398 | 0.417
4peptides
spectra
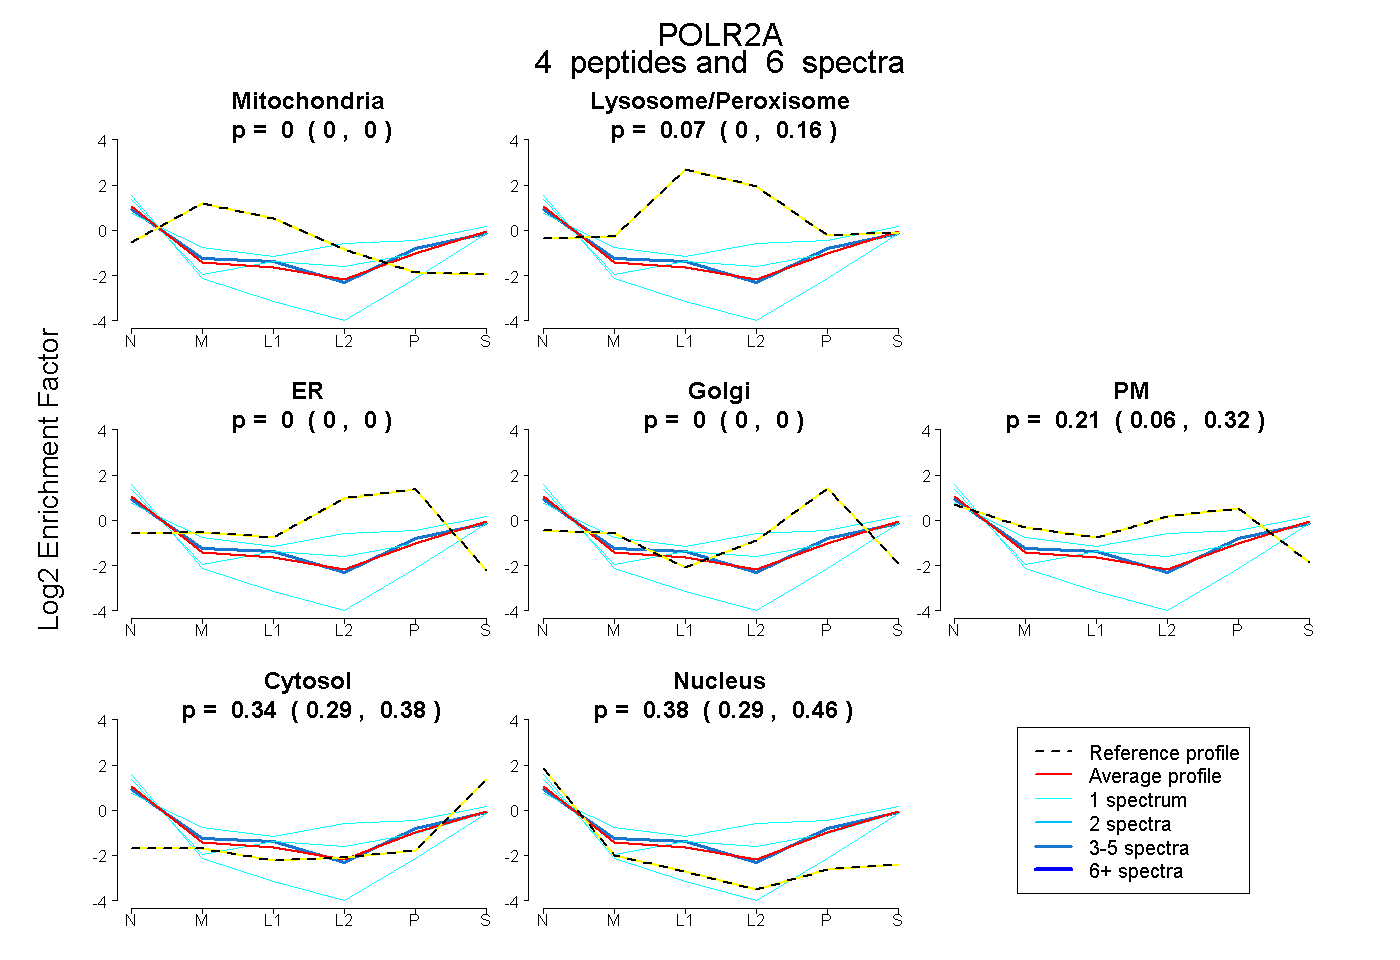
0.000 | 0.000
0.000 | 0.156
0.000 | 0.000
0.000 | 0.000
0.057 | 0.318
0.291 | 0.375
0.294 | 0.457
2peptides
spectra
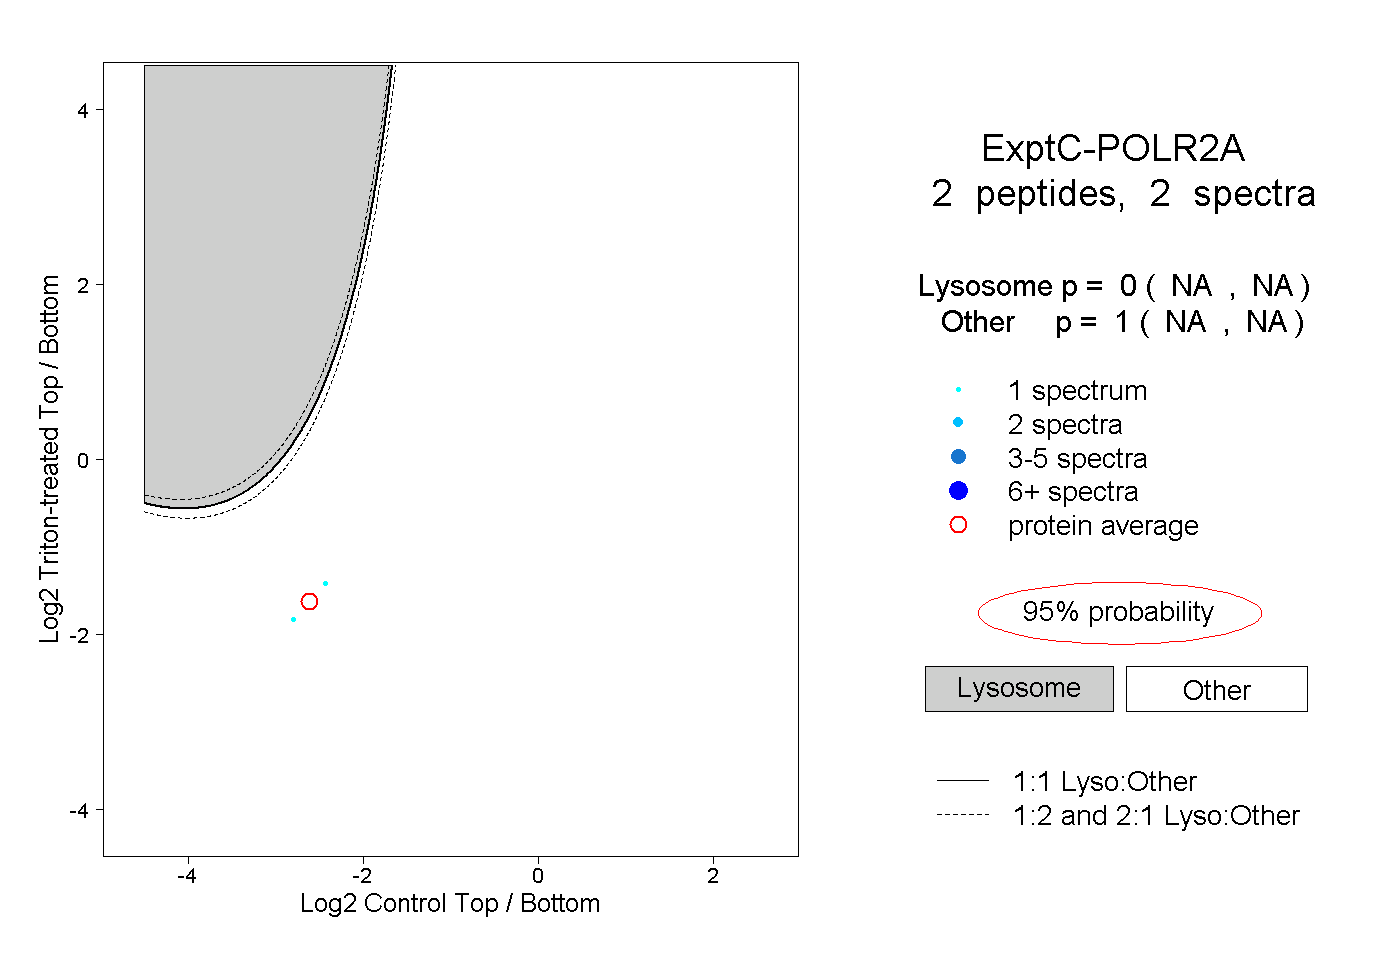
NA | NA
NA | NA