POLR2A
[ENSRNOP00000061492]
Main page
| | | Plot |
Mito |
Lyso |
|
Perox |
ER |
Golgi |
PM |
Cytosol |
Nucleus |
|
| Expt A |
 20
20
peptides |
40
spectra |
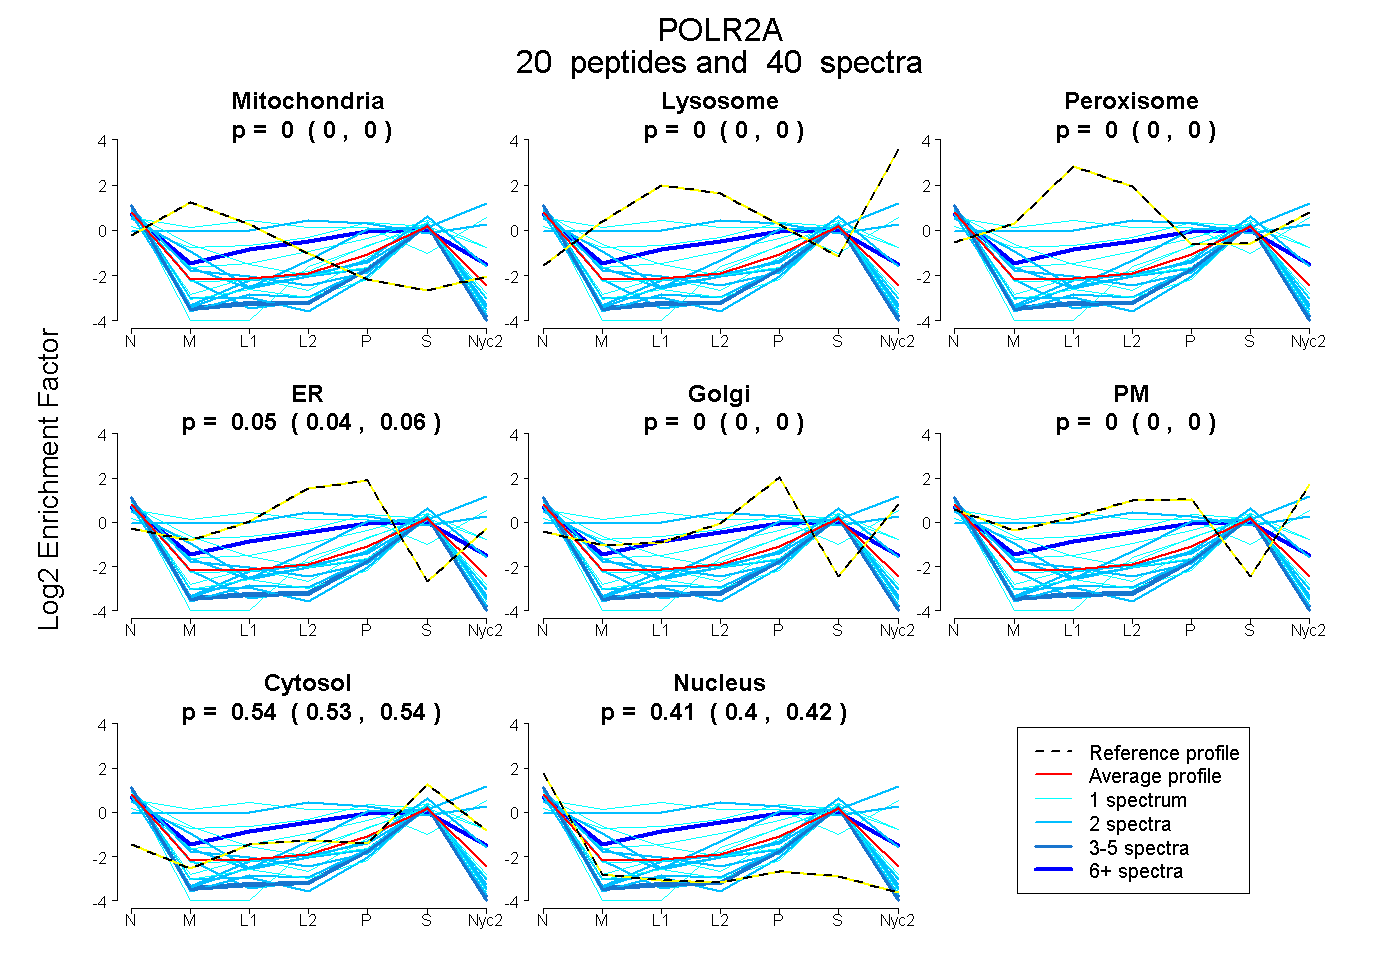 |
0.000
0.000 | 0.000 |
0.000
0.000 | 0.000 |
|
0.000
0.000 | 0.000 |
0.054
0.044 | 0.063 |
0.000
0.000 | 0.000 |
0.000
0.000 | 0.000 |
0.537
0.529 | 0.544 |
0.409
0.398 | 0.417 |
|
| | | Plot |
Mito |
|
Lyso or Perox |
|
ER |
Golgi |
PM |
Cytosol |
Nucleus |
|
| Expt B |
4
peptides |
6
spectra |
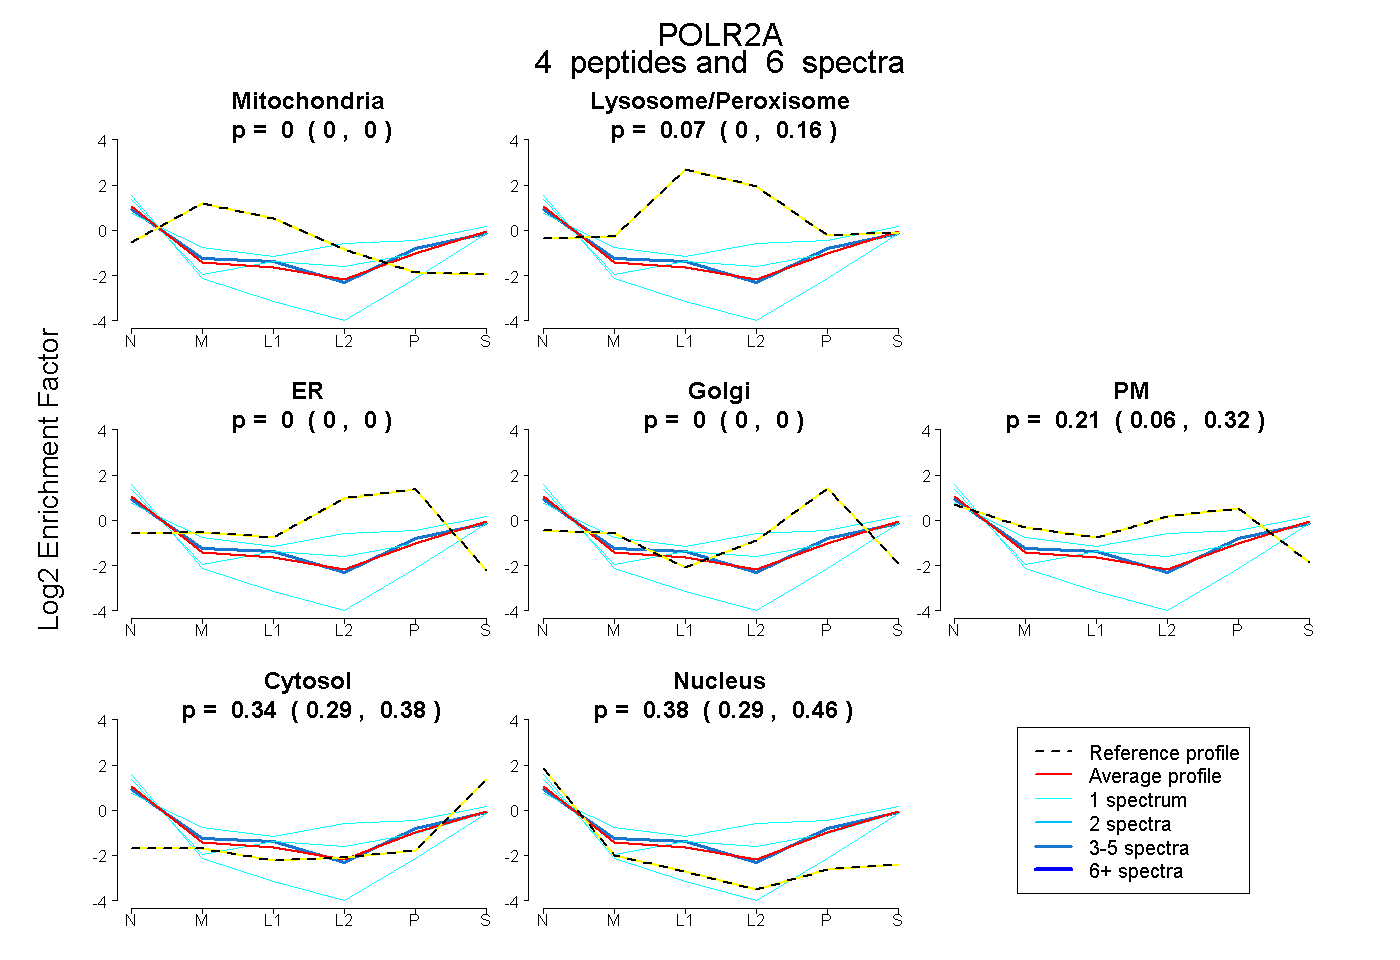 |
0.000
0.000 | 0.000 |
|
0.069
0.000 | 0.156 |
|
0.000
0.000 | 0.000 |
0.000
0.000 | 0.000 |
0.212
0.057 | 0.318 |
0.339
0.291 | 0.375 |
0.379
0.294 | 0.457 |
|
| 1 spectrum, VVLPCNLLR |
0.000 |
|
0.000 |
|
0.000 |
0.000 |
0.000 |
0.299 |
0.701 |
|
| 3 spectra, IFHINPR |
0.000 |
|
0.083 |
|
0.000 |
0.000 |
0.231 |
0.333 |
0.353 |
|
| 1 spectrum, NVTLGVPR |
0.000 |
|
0.113 |
|
0.000 |
0.000 |
0.472 |
0.341 |
0.074 |
|
| 1 spectrum, ISPWLLR |
0.000 |
|
0.180 |
|
0.000 |
0.000 |
0.139 |
0.256 |
0.424 |
|
| | | Plot |
|
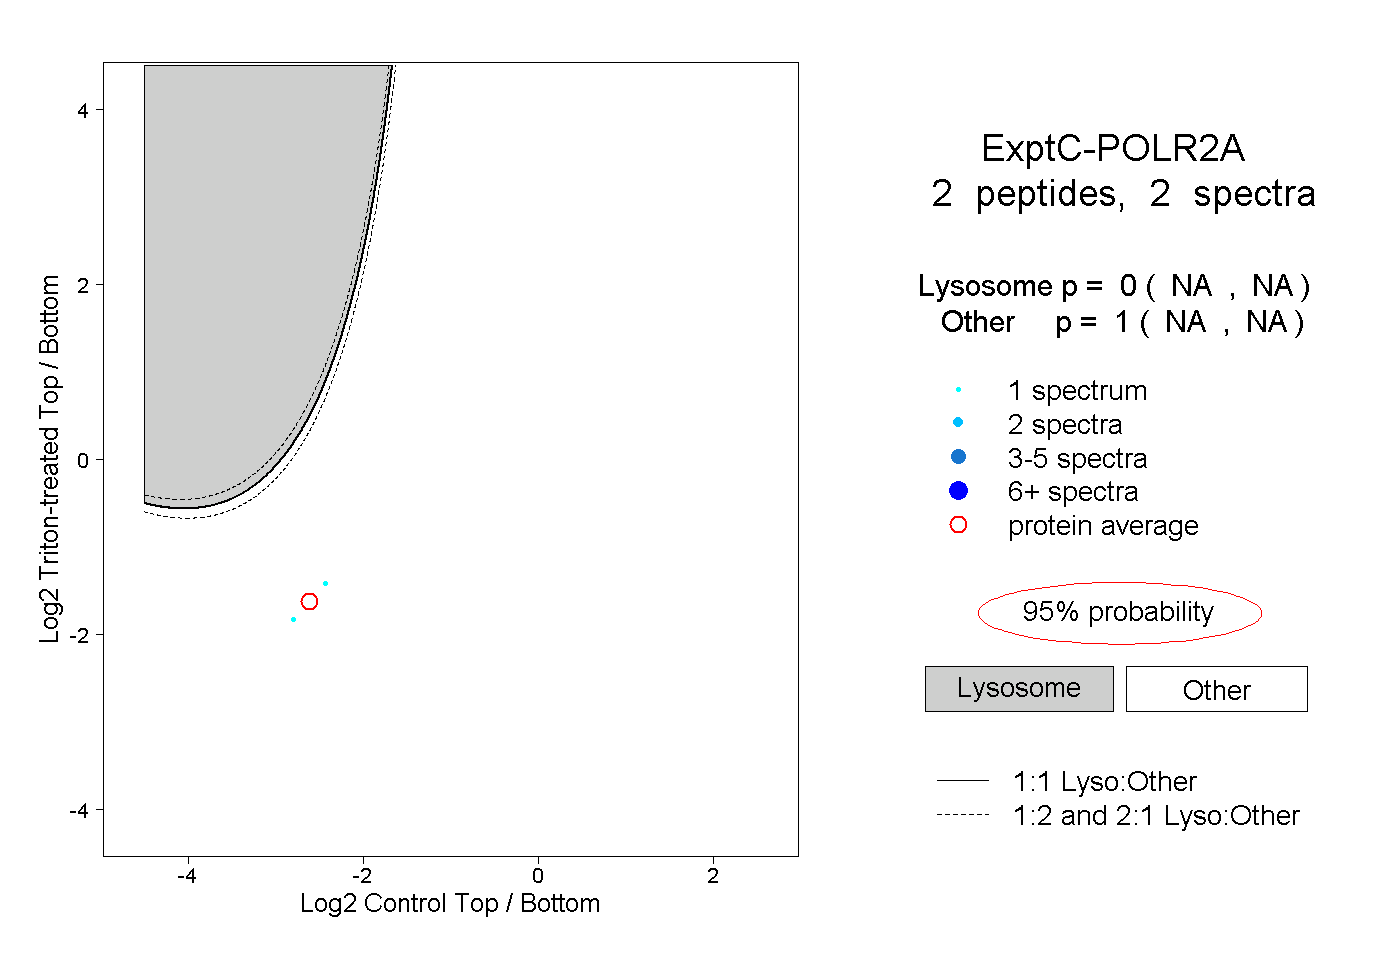
Lyso |
|
|
|
|
|
|
|
Other |
| Expt C |
2
peptides |
2
spectra |
 |
|
0.000
NA | NA |
|
|
|
|
|
|
|
1.000
NA | NA |