 11
11peptides
spectra
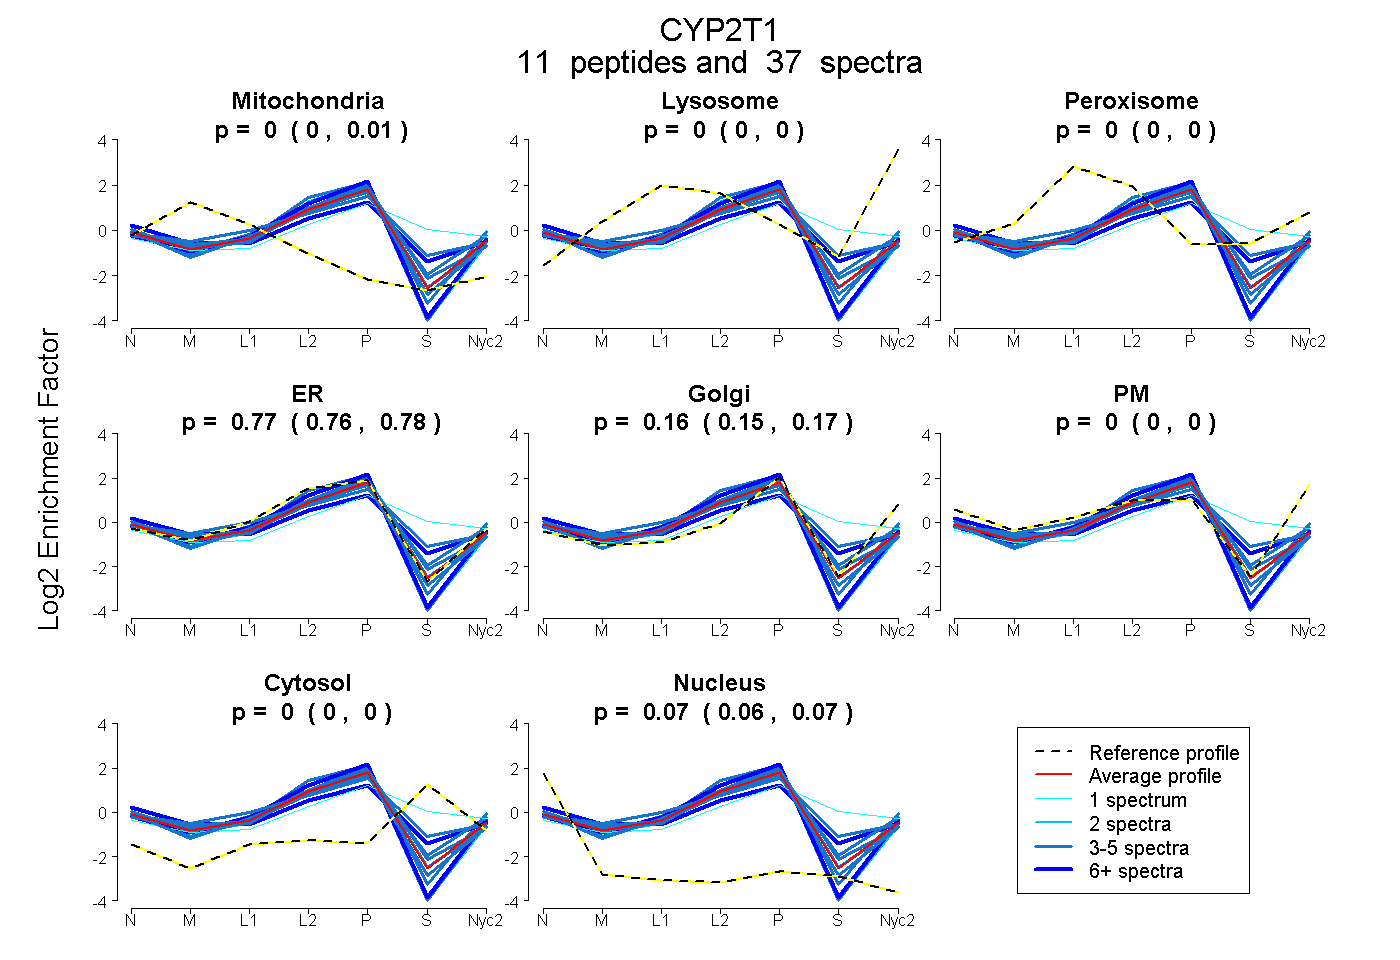
0.000 | 0.005
0.000 | 0.000
0.000 | 0.000
0.757 | 0.783
0.148 | 0.173
0.000 | 0.000
0.000 | 0.003
0.061 | 0.068
7peptides
spectra
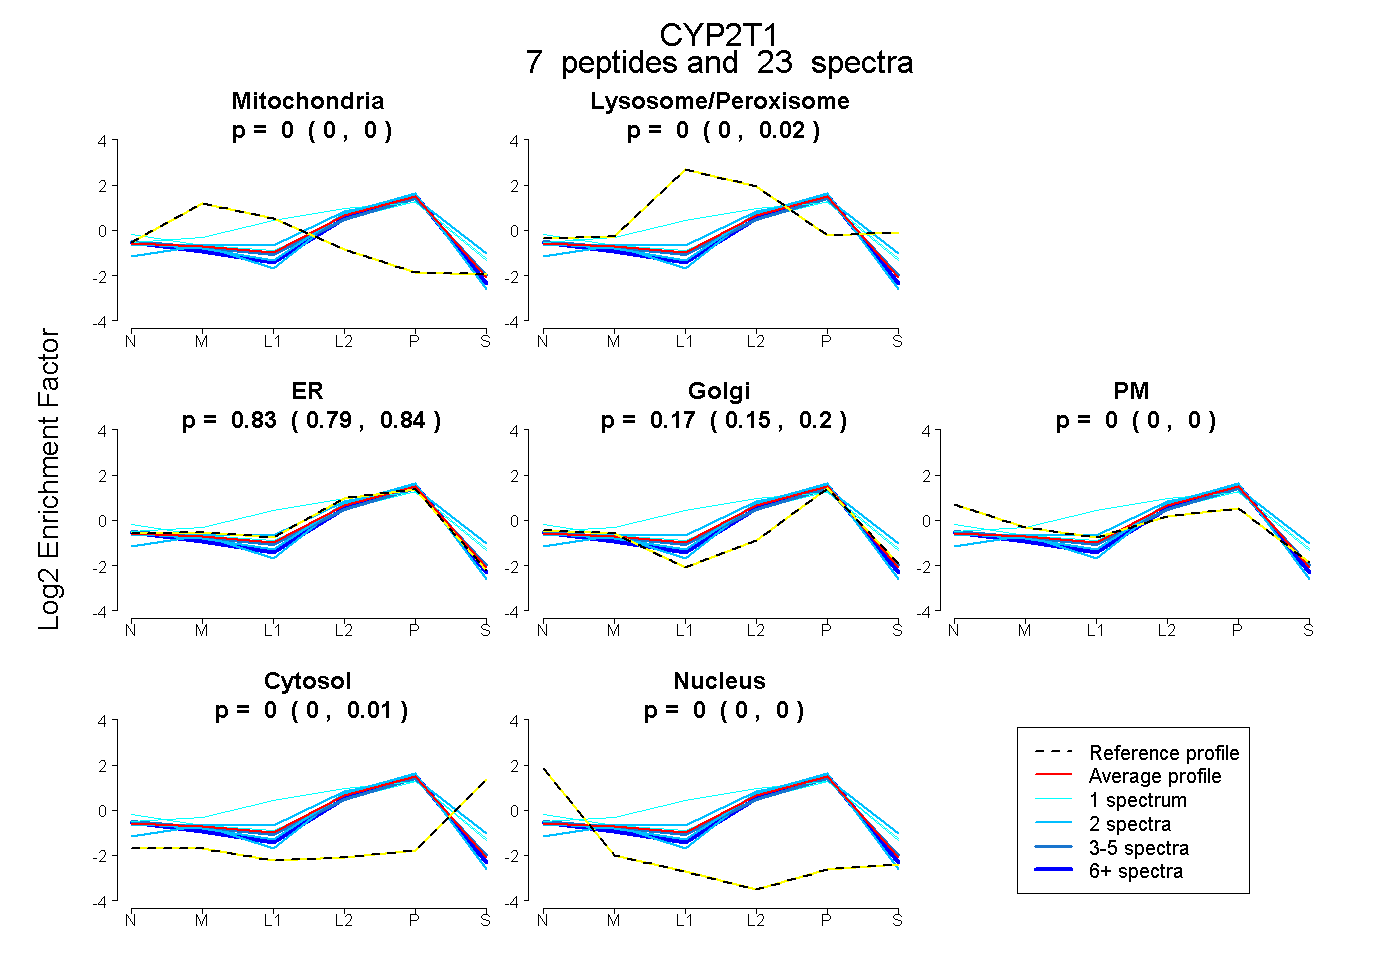
0.000 | 0.000
0.000 | 0.017
0.787 | 0.844
0.149 | 0.197
0.000 | 0.000
0.000 | 0.011
0.000 | 0.000
12peptides
spectra
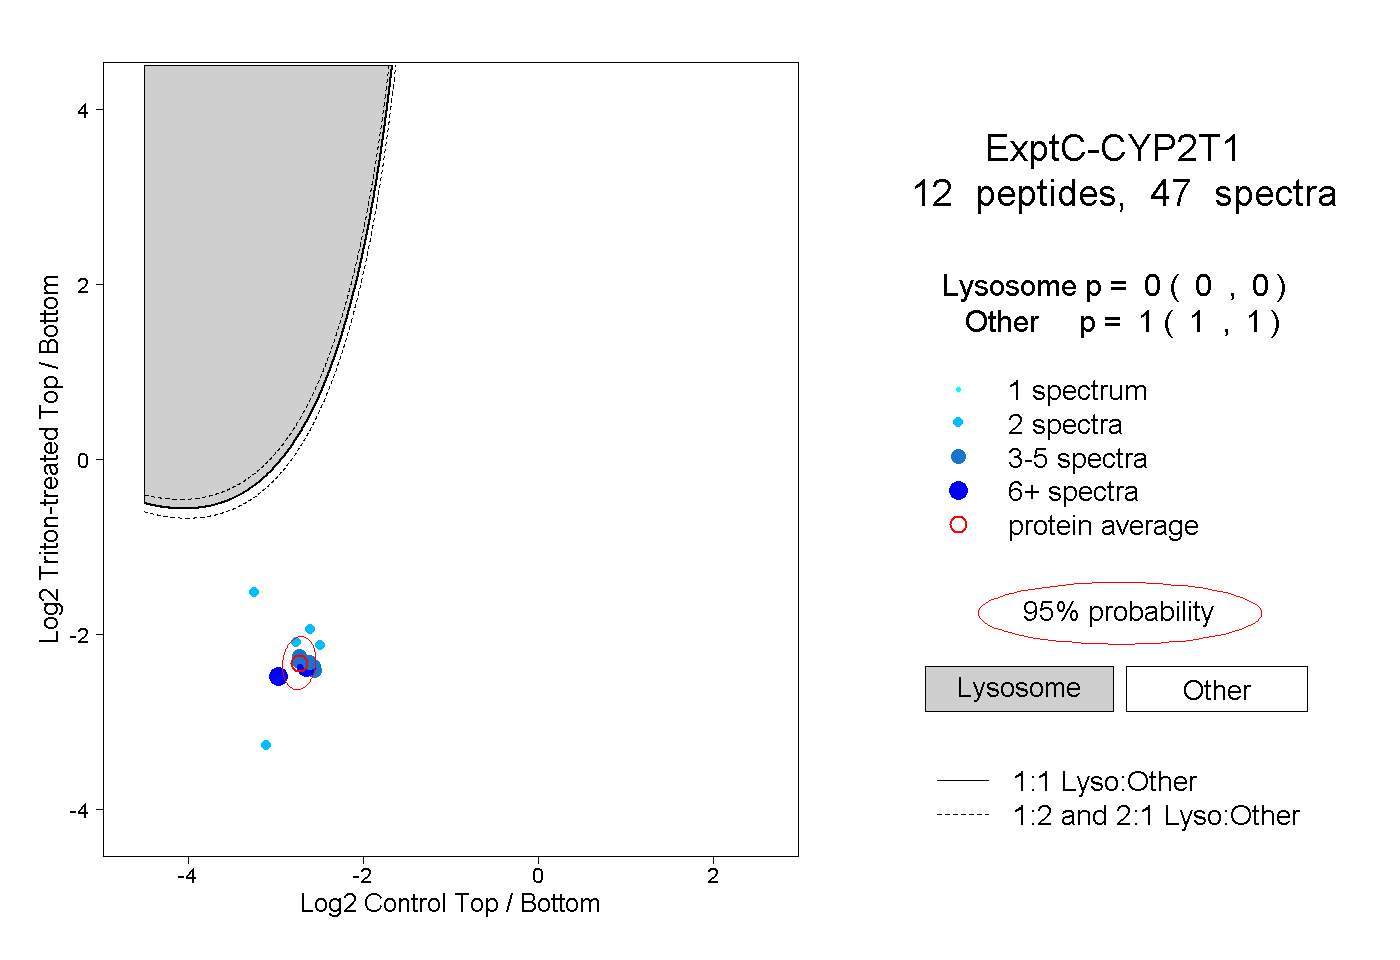
0.000 | 0.000
1.000 | 1.000
4peptides
spectra
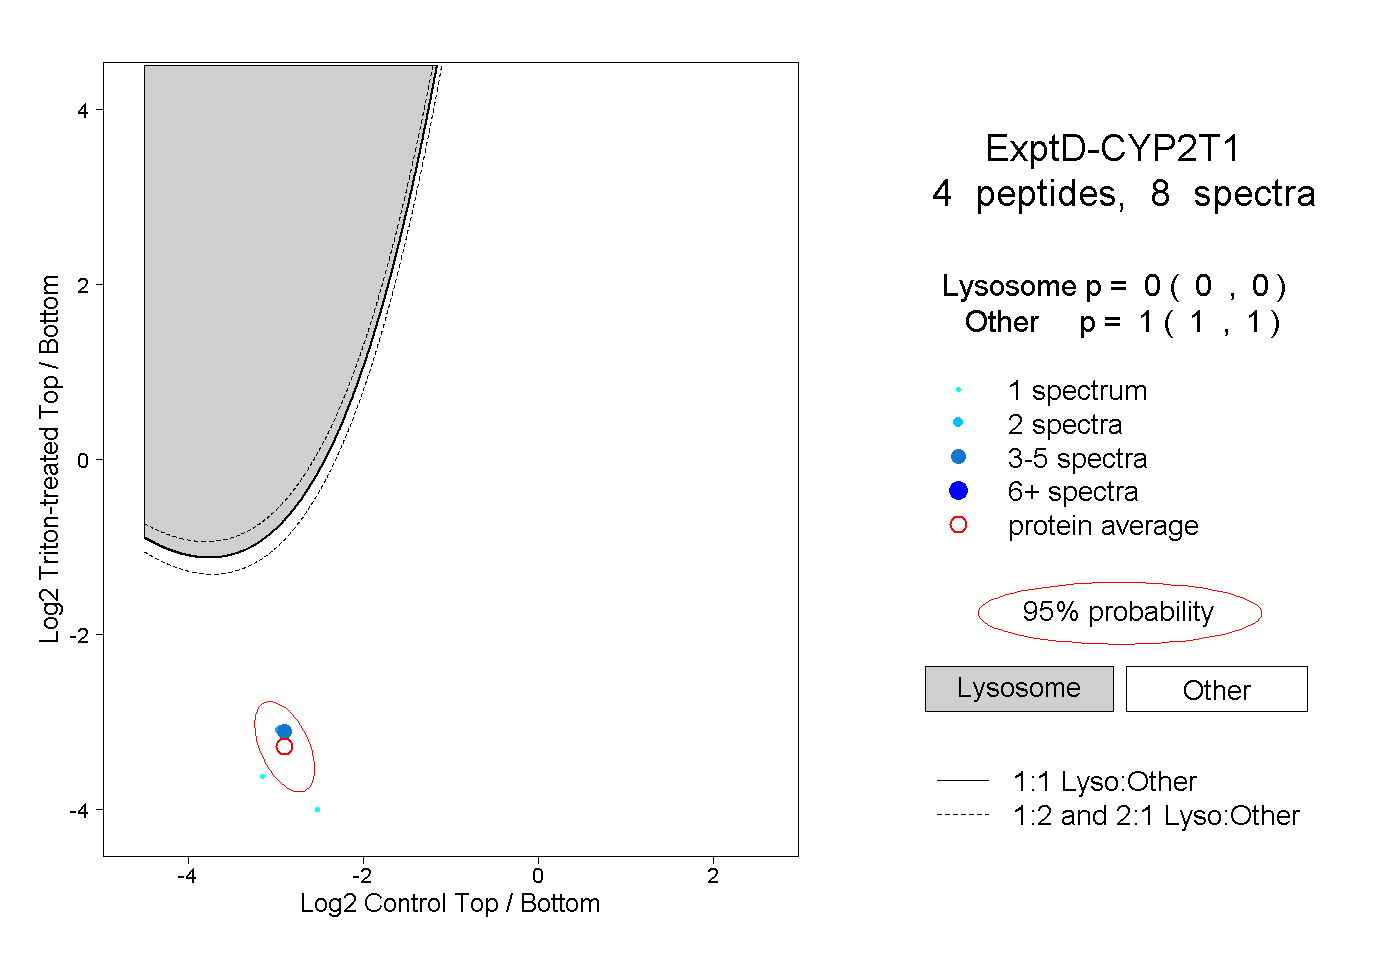
0.000 | 0.000
1.000 | 1.000