CYP2T1
[ENSRNOP00000061482]
Main page
| | | Plot |
Mito |
Lyso |
|
Perox |
ER |
Golgi |
PM |
Cytosol |
Nucleus |
|
| Expt A |
 11
11
peptides |
37
spectra |
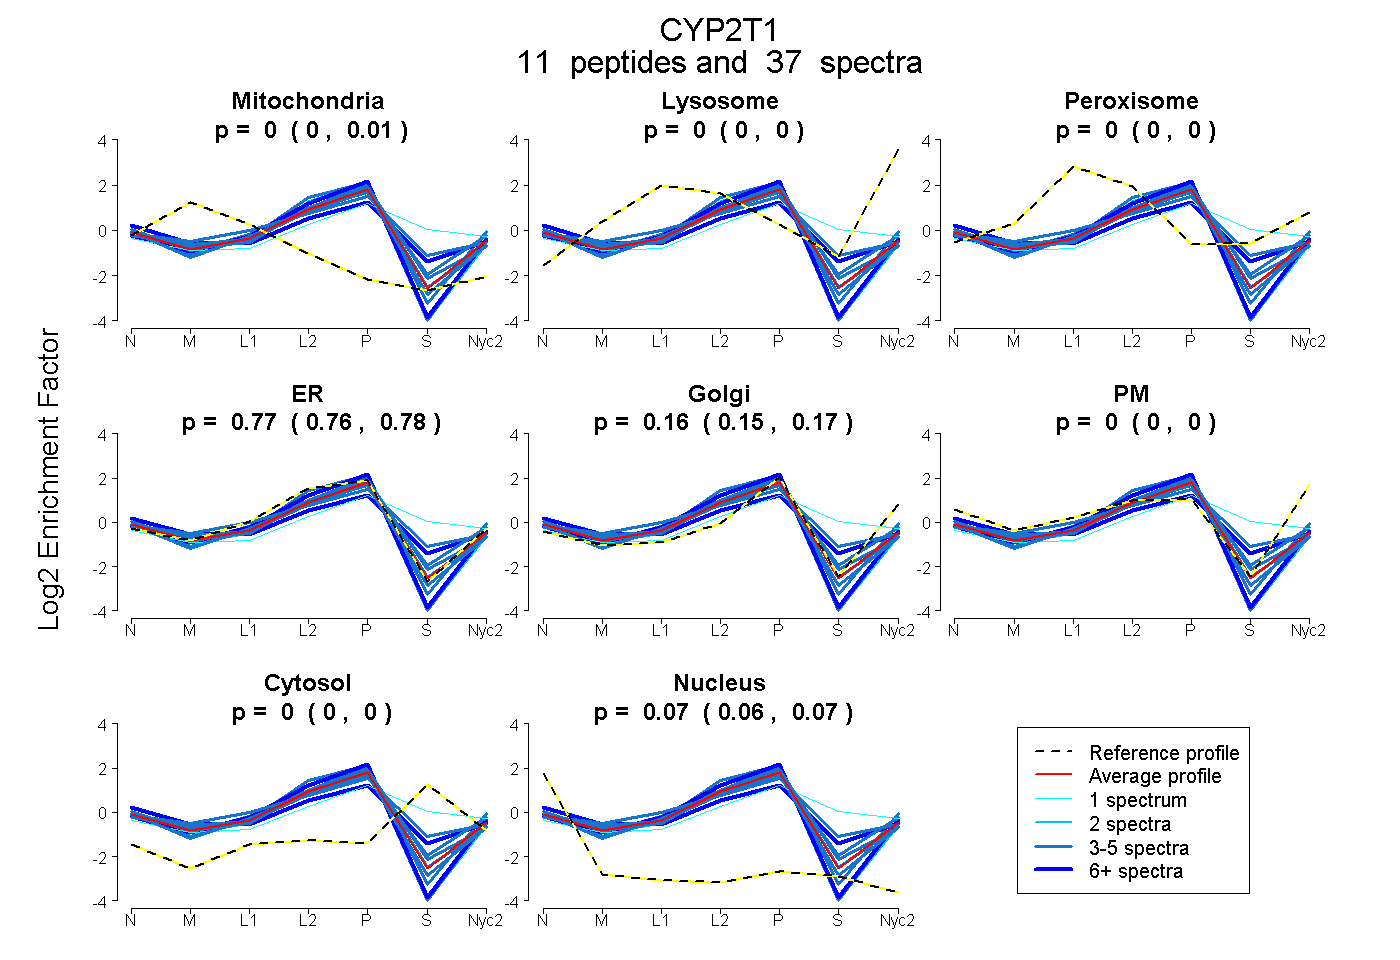 |
0.000
0.000 | 0.005 |
0.000
0.000 | 0.000 |
|
0.000
0.000 | 0.000 |
0.772
0.757 | 0.783 |
0.161
0.148 | 0.173 |
0.000
0.000 | 0.000 |
0.000
0.000 | 0.003 |
0.066
0.061 | 0.068 |
|
| | | Plot |
Mito |
|
Lyso or Perox |
|
ER |
Golgi |
PM |
Cytosol |
Nucleus |
|
| Expt B |
7
peptides |
23
spectra |
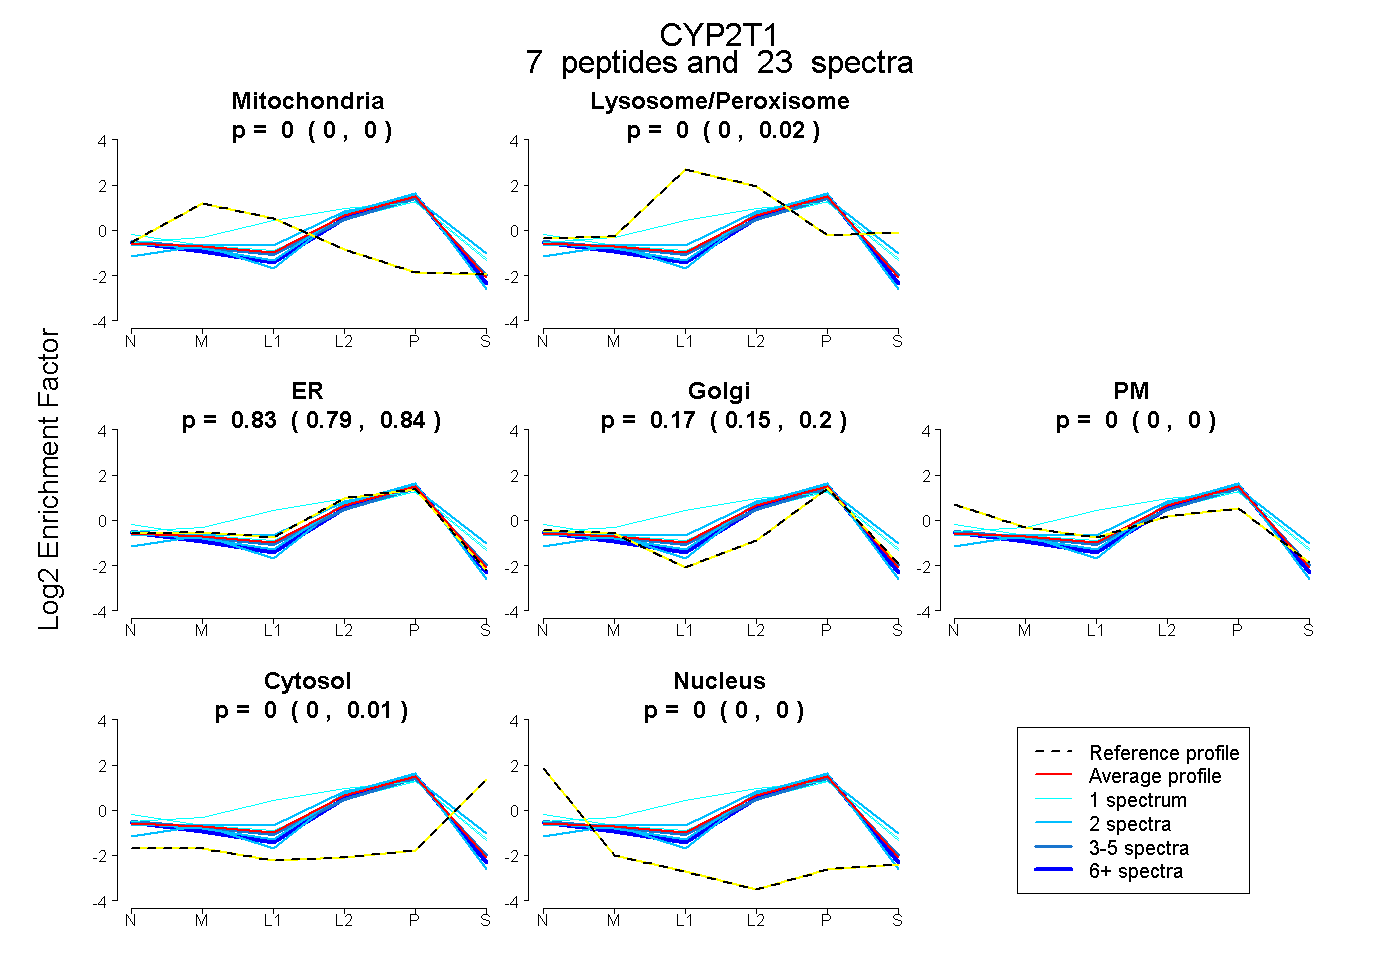 |
0.000
0.000 | 0.000 |
|
0.000
0.000 | 0.017 |
|
0.826
0.787 | 0.844 |
0.173
0.149 | 0.197 |
0.000
0.000 | 0.000 |
0.001
0.000 | 0.011 |
0.000
0.000 | 0.000 |
|
| 10 spectra, LLDLFSDNFR |
0.000 |
|
0.000 |
|
0.670 |
0.330 |
0.000 |
0.000 |
0.000 |
|
| 1 spectrum, YGLLIMLK |
0.000 |
|
0.349 |
|
0.509 |
0.142 |
0.000 |
0.000 |
0.000 |
|
| 5 spectra, VQEELDATVGR |
0.000 |
|
0.017 |
|
0.696 |
0.279 |
0.000 |
0.008 |
0.000 |
|
| 2 spectra, VLMELSSR |
0.000 |
|
0.000 |
|
0.714 |
0.286 |
0.000 |
0.000 |
0.000 |
|
| 1 spectrum, NFQELR |
0.000 |
|
0.170 |
|
0.335 |
0.405 |
0.072 |
0.018 |
0.000 |
|
| 2 spectra, YNYGDPEFLR |
0.000 |
|
0.000 |
|
0.790 |
0.210 |
0.000 |
0.000 |
0.000 |
|
| 2 spectra, NHFLHK |
0.000 |
|
0.094 |
|
0.772 |
0.000 |
0.000 |
0.133 |
0.000 |
|
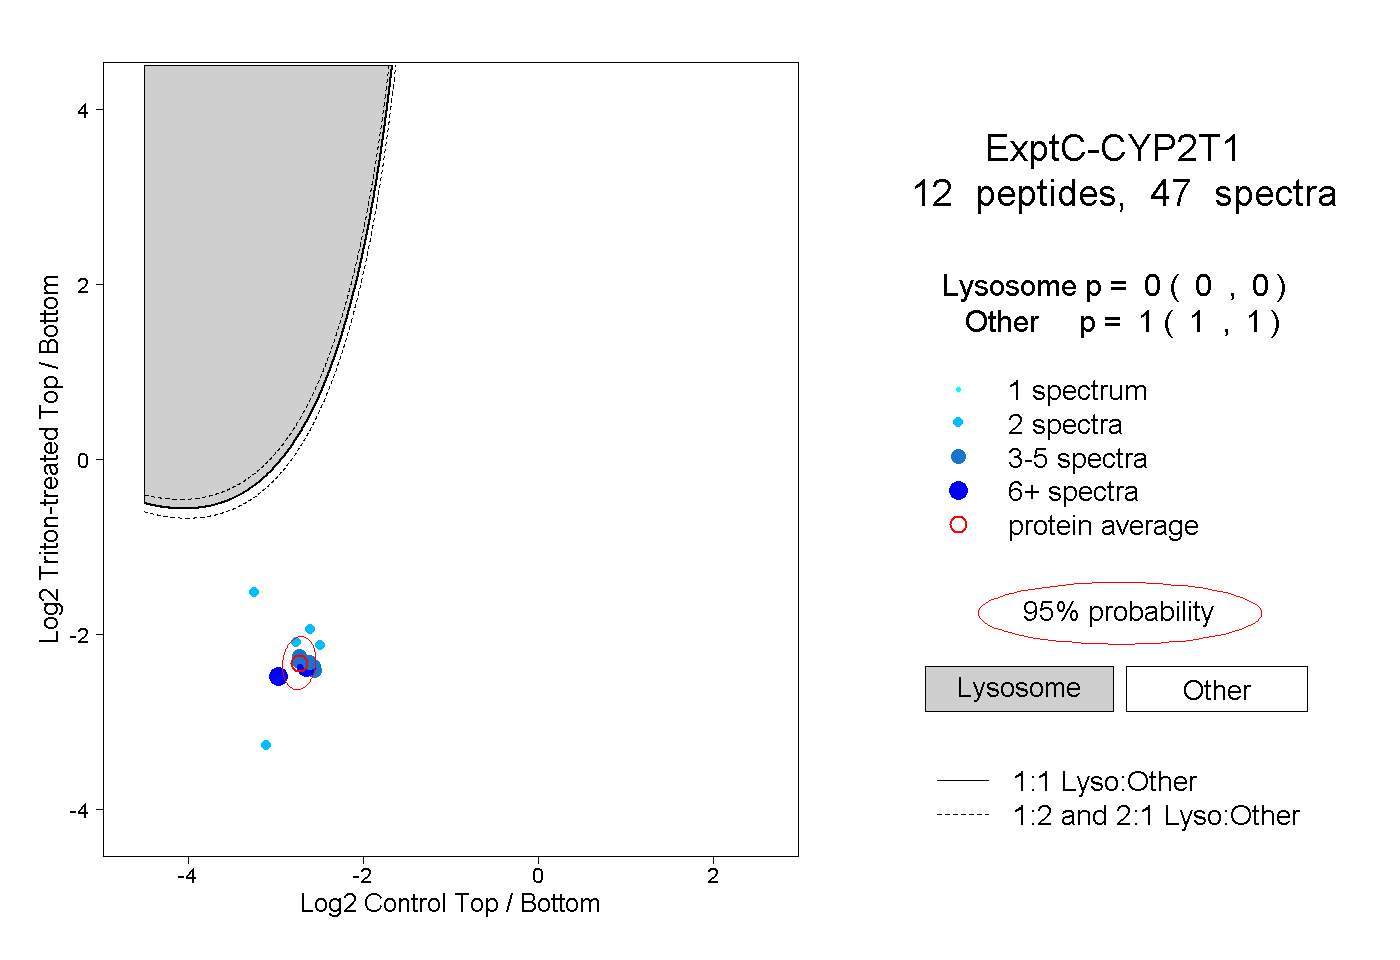
| | | Plot |
|
Lyso |
|
|
|
|
|
|
|
Other |
| Expt C |
12
peptides |
47
spectra |
 |
|
0.000
0.000 | 0.000 |
|
|
|
|
|
|
|
1.000
1.000 | 1.000 |
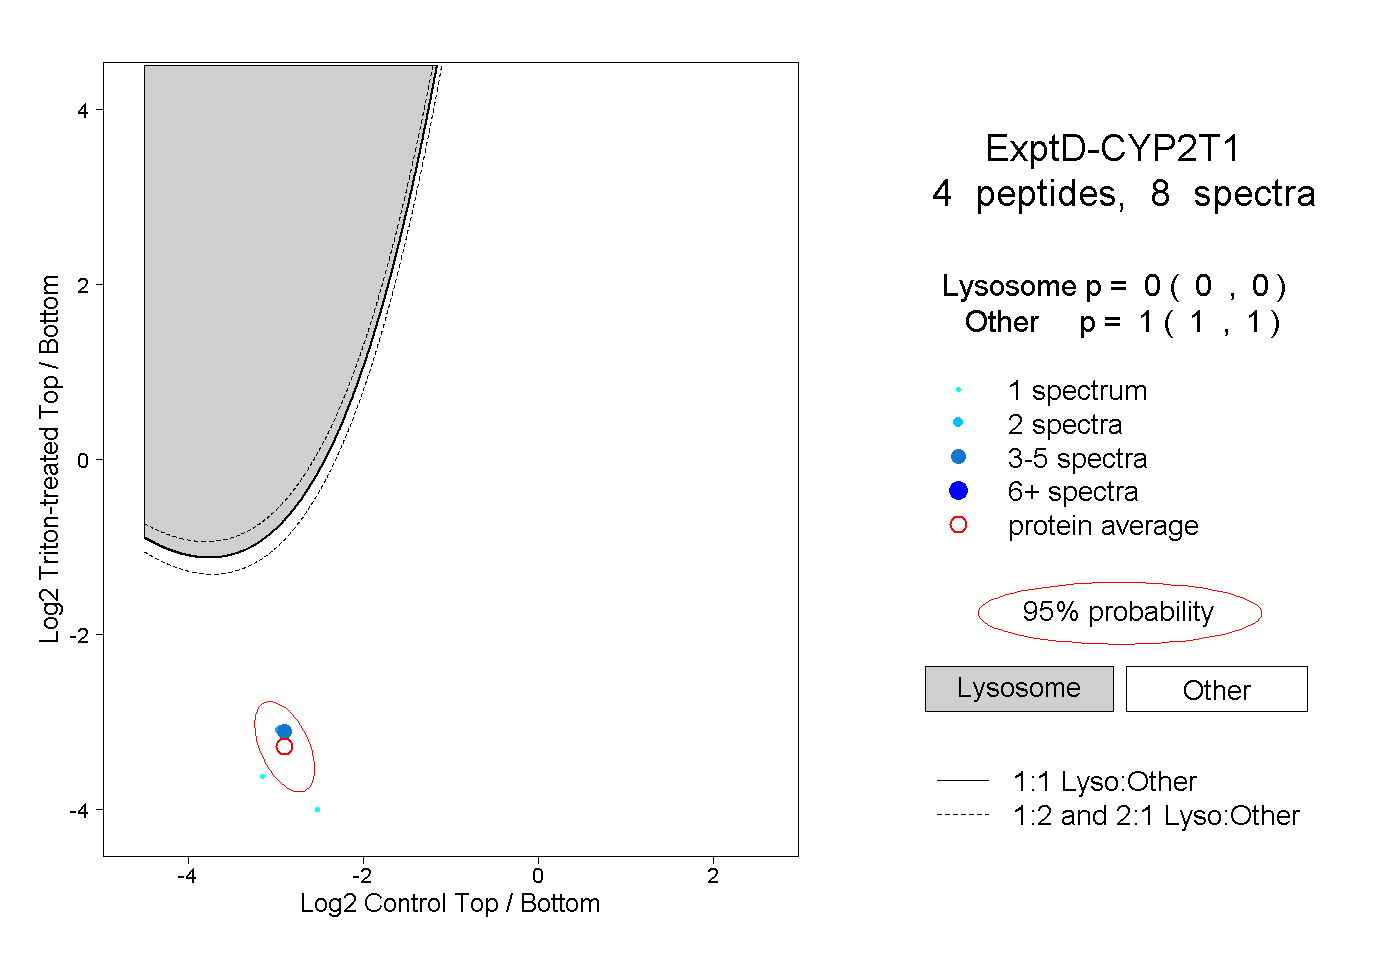
| | | Plot |
|
Lyso |
|
|
|
|
|
|
|
Other |
| Expt D |
4
peptides |
8
spectra |
 |
|
0.000
0.000 | 0.000 |
|
|
|
|
|
|
|
1.000
1.000 | 1.000 |