 3
3peptides
spectra
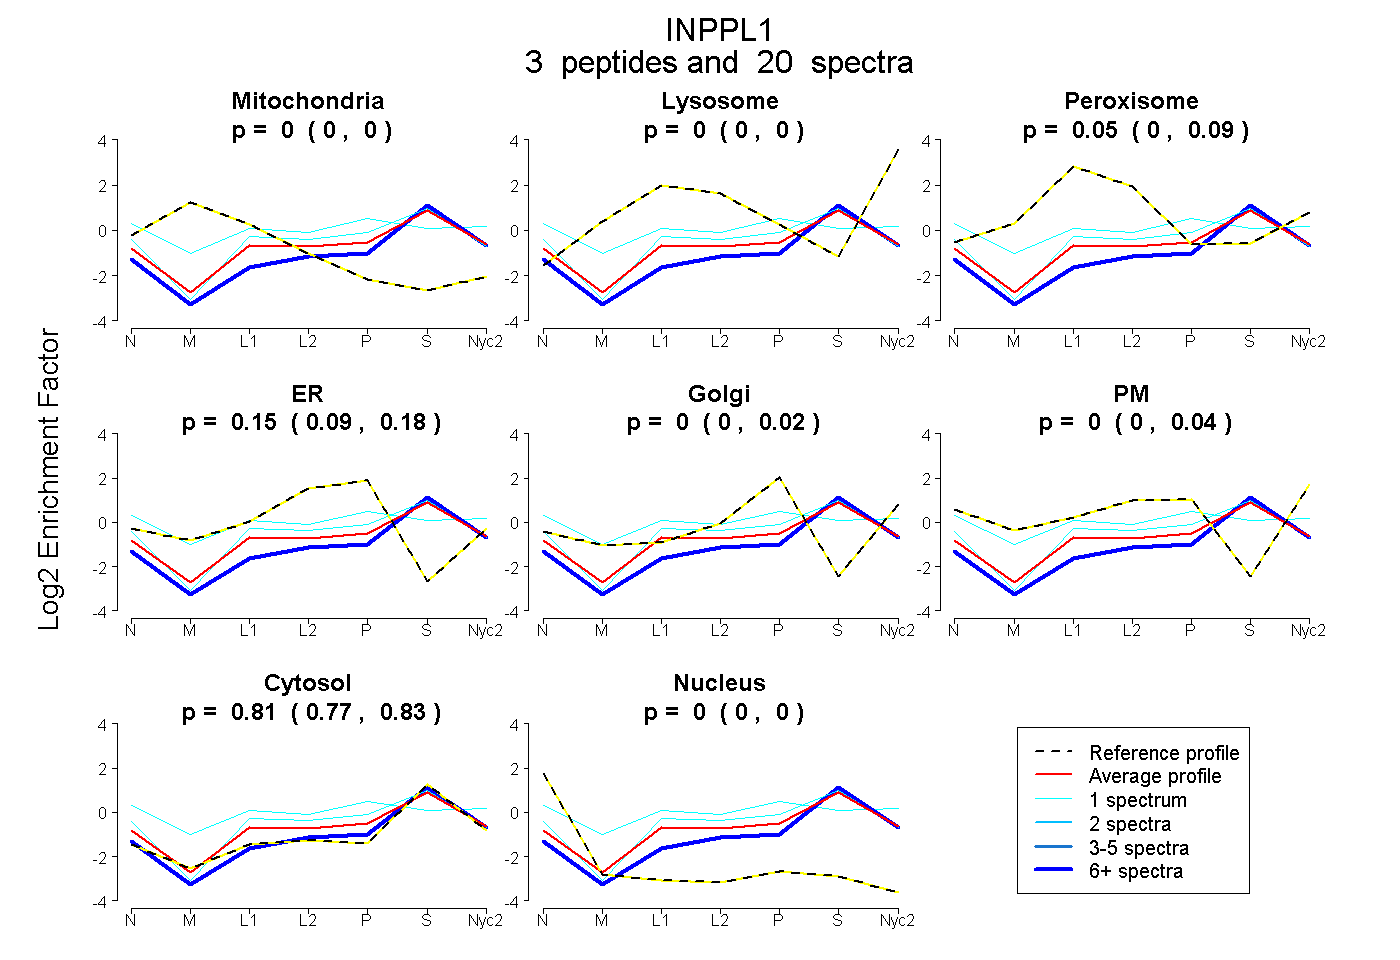
0.000 | 0.000
0.000 | 0.000
0.000 | 0.090
0.086 | 0.175
0.000 | 0.019
0.000 | 0.044
0.770 | 0.831
0.000 | 0.000
2peptides
spectra
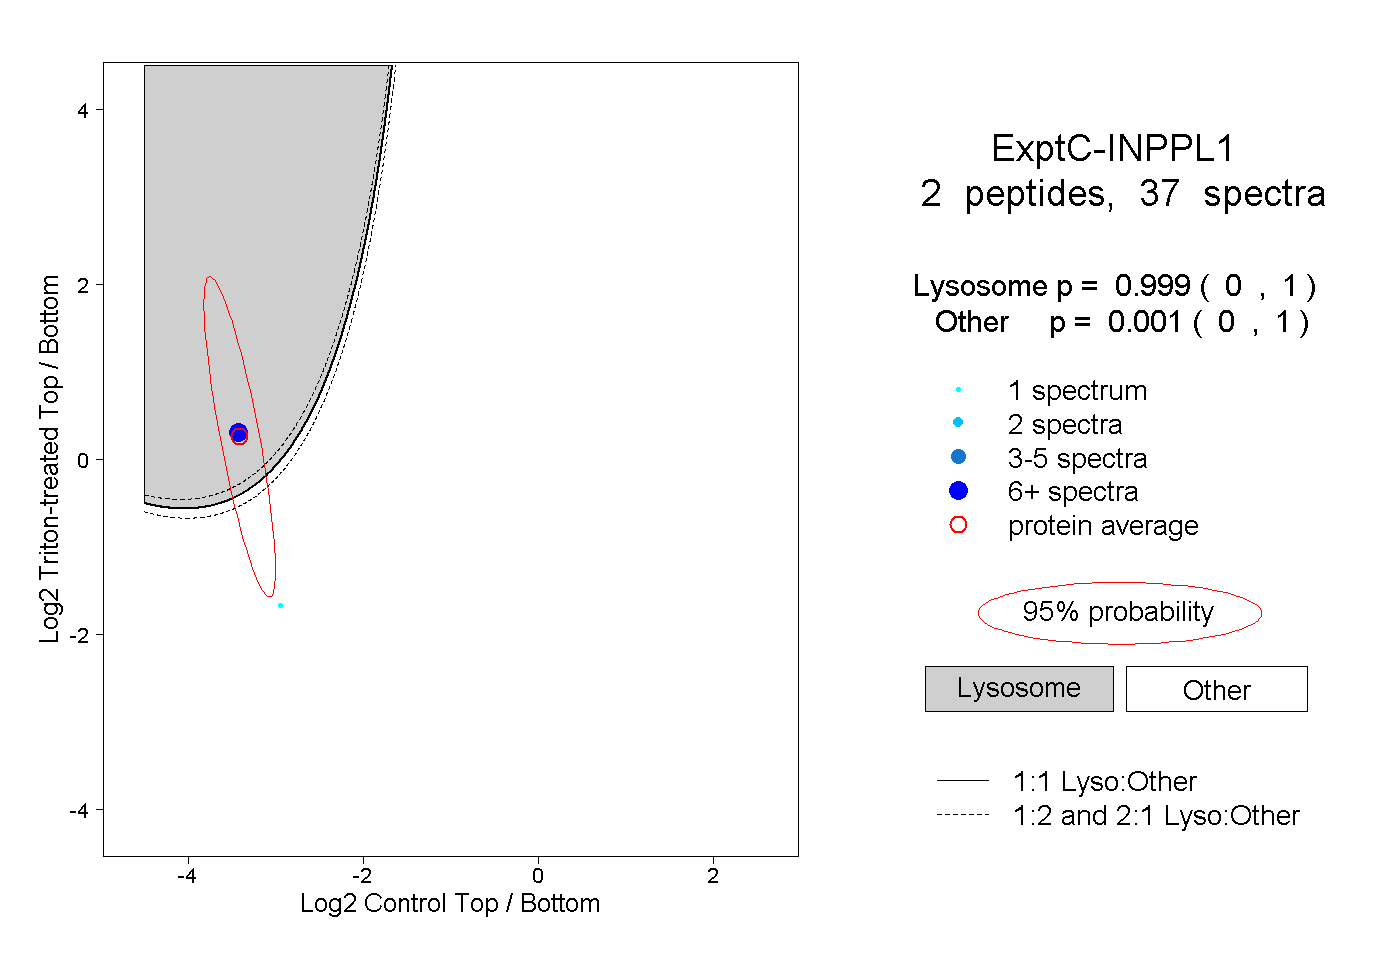
0.000 | 1.000
0.000 | 1.000
2peptides
spectra
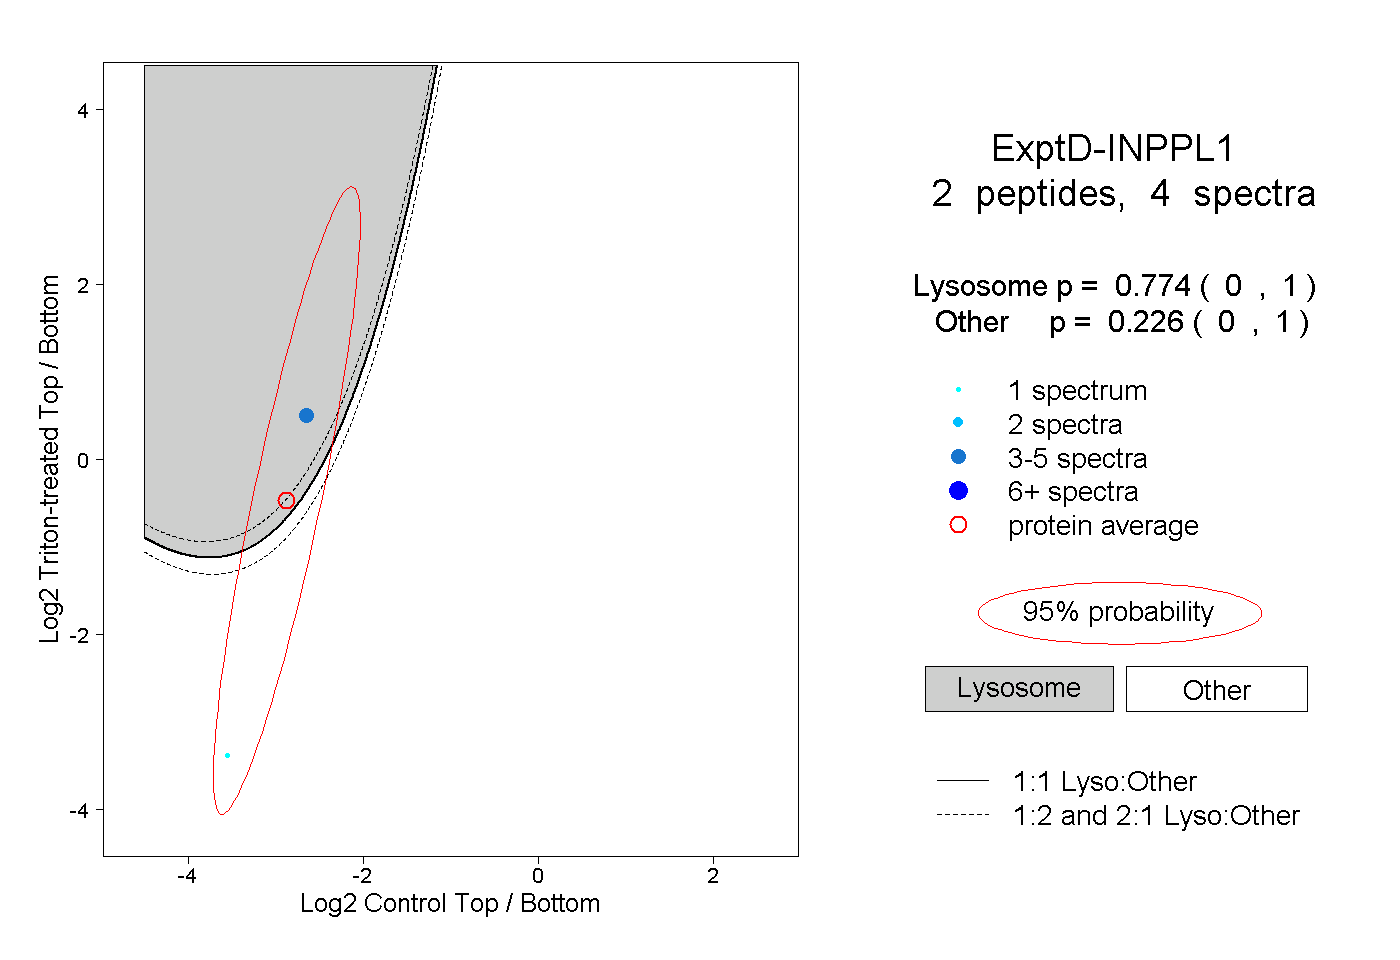
0.000 | 1.000
0.000 | 1.000