 3
3peptides
spectra
0.000 | 0.000
0.000 | 0.000
0.000 | 0.090
0.086 | 0.175
0.000 | 0.019
0.000 | 0.044
0.770 | 0.831
0.000 | 0.000
| Plot | Mito | Lyso | Perox | ER | Golgi | PM | Cytosol | Nucleus | |||||
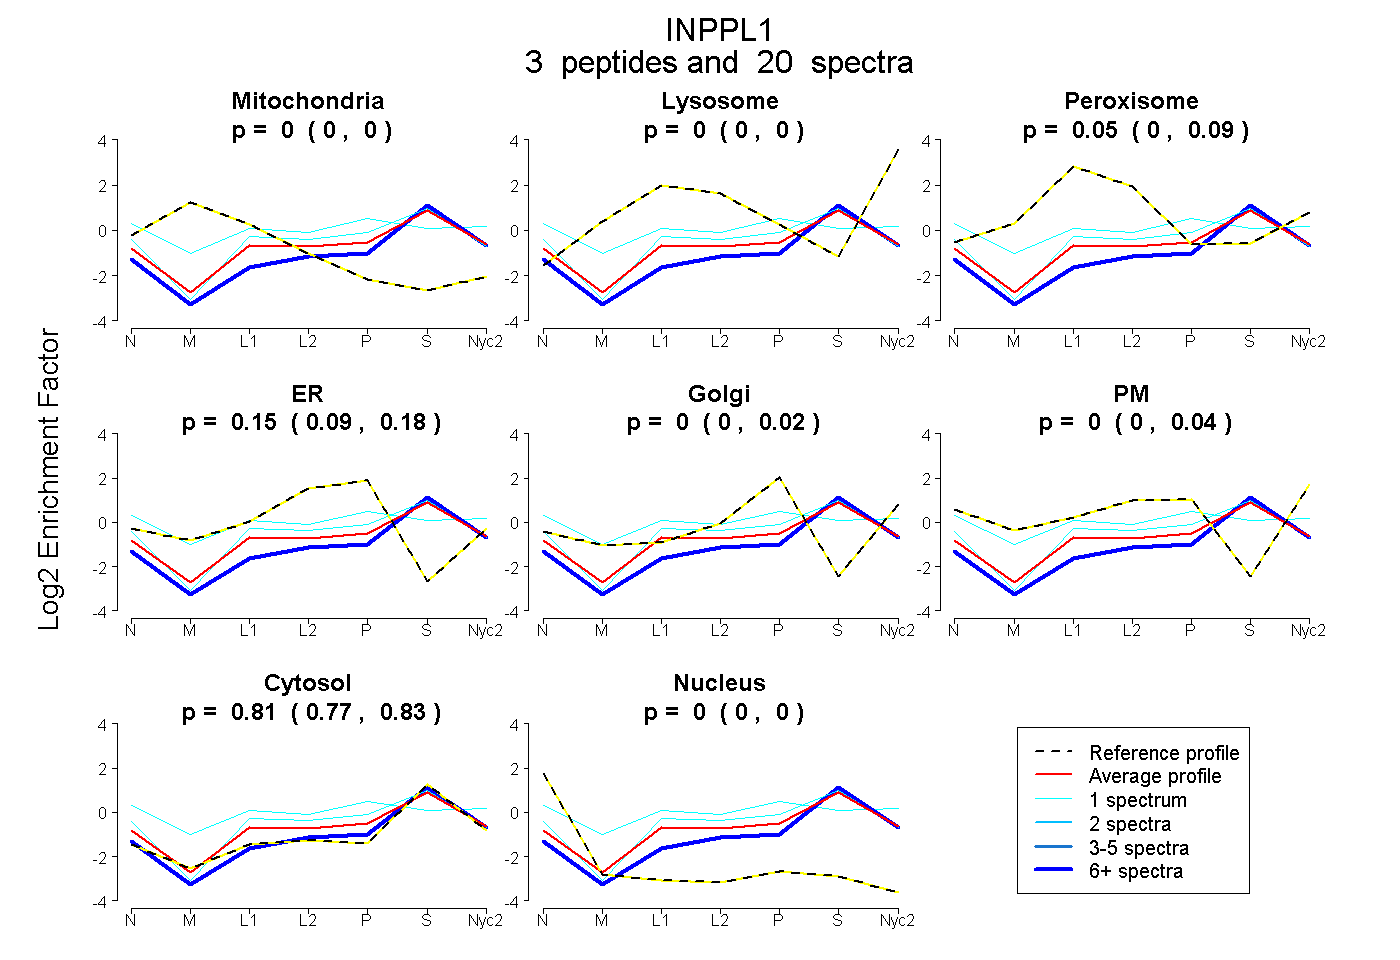
| Expt A |
3 peptides |
20 spectra |
|
0.000 0.000 | 0.000 |
0.000 0.000 | 0.000 |
0.048 0.000 | 0.090 |
0.146 0.086 | 0.175 |
0.000 0.000 | 0.019 |
0.000 0.000 | 0.044 |
0.805 0.770 | 0.831 |
0.000 0.000 | 0.000 |
| 18 spectra, LVLLR | 0.000 | 0.000 | 0.000 | 0.000 | 0.036 | 0.000 | 0.961 | 0.003 | ||
| 1 spectrum, EAFCQLLQLMK | 0.000 | 0.000 | 0.167 | 0.001 | 0.082 | 0.348 | 0.402 | 0.000 | ||
| 1 spectrum, TLVTSCR | 0.000 | 0.000 | 0.066 | 0.189 | 0.000 | 0.000 | 0.745 | 0.000 |
| Plot | Lyso | Other | |||||||||||
| Expt C |
2 peptides |
37 spectra |
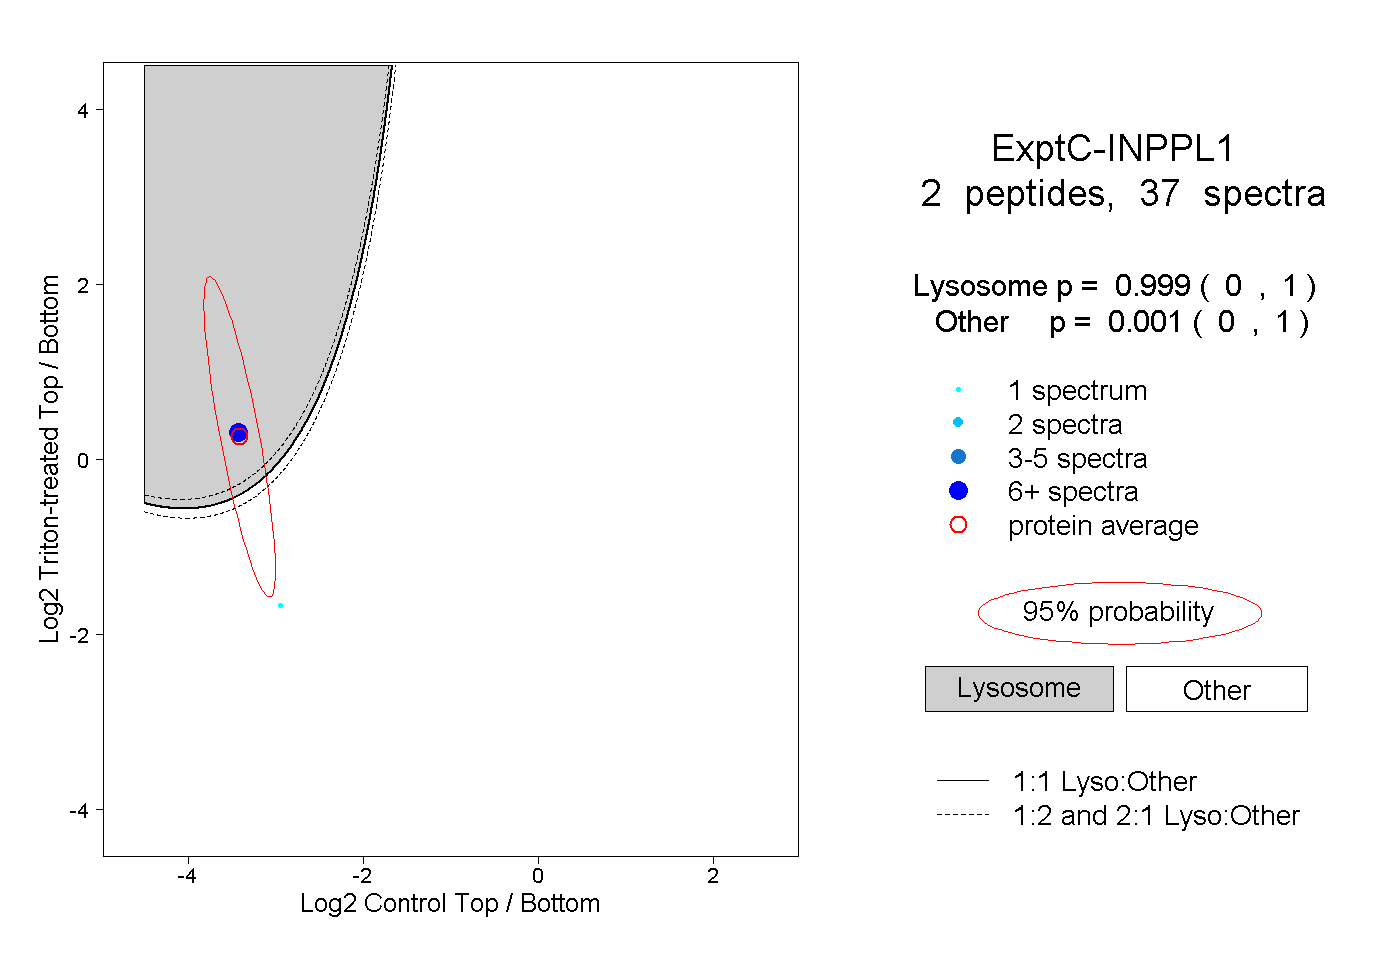 |
0.999 0.000 | 1.000 |
0.001 0.000 | 1.000 |
||||||||
| Plot | Lyso | Other | |||||||||||
| Expt D |
2 peptides |
4 spectra |
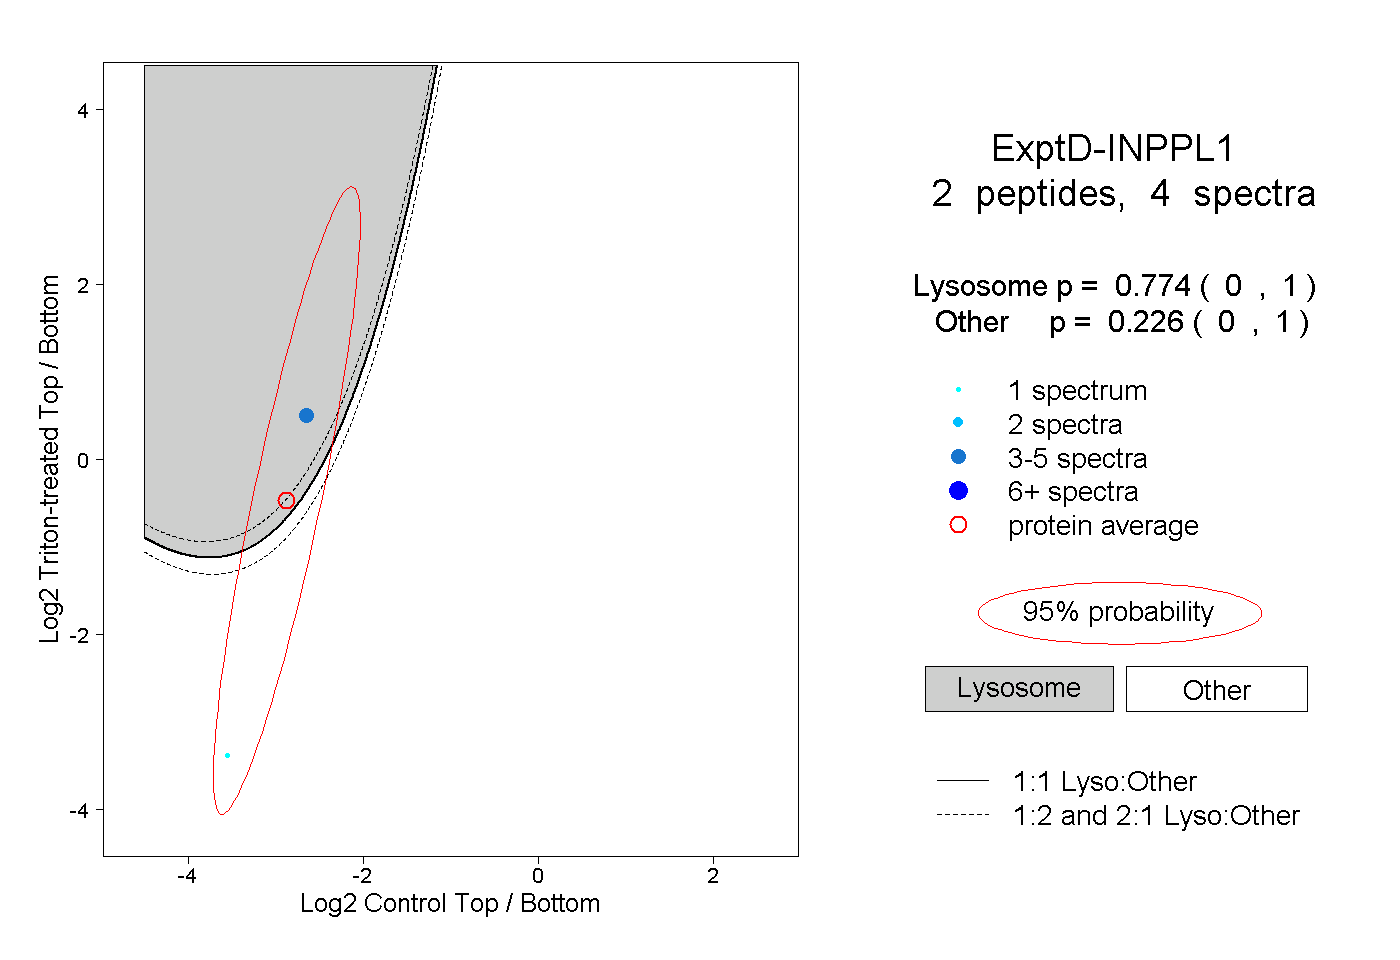 |
0.774 0.000 | 1.000 |
0.226 0.000 | 1.000 |